Monday, January 31, 2011

Market Outlook

Nice drop on Friday. The market started to fall too early for me. It did not even wait for the 10 a.m. data.

However, it seems bearishness is already too high:

This is why I would not be surprised by a move back to the recent highs this week.

For my ST Trading, if conditions seem right, I will try to buy a decent drop today before the lunch, around SPX 1270.

Longer term, I am waiting for an opportunity to go short for an IT correction, but I will be selective. This is still a bull market.

Friday, January 28, 2011

GDP At A Glance

Today's GDP report was strong, consistent with a continuing expansion. The consumers are really taking over. Some positive highlights:

> the durable goods contribution to the GDP jumped a lot;
> Final Sales to Domestic Purchasers increased by 3,4 % yoy, a good rate;
> non residential structures and residential investment made positive contributions.

However, this is history. The market already knows it and I think this will become evident in the following days.

Looking into the future, it seems businesses are not very optimistic since they aggressively cut their inventories.

Trade Plan

I have a high degree of confidence that we are near a IT top so I am ready to go short. Since going short against a strong uptrend is risky whatever the context, I have two requirements that need to be met:

> a significant rally in the first part of the session. I looked in the past and previous tops happened after the market was at least 0.5% above the 7 h EMA. In our case this would mean SPX around 1305.

> a spike in the put/call ratio. This is a bit of a problem given the recent behavior of the cpc:

It is oversold despite the recent rally in the markets. This is typical behavior before a more important top, in my experience. However, usually tops do not arrive before a more significant bullish spike in the ratio. So, what I will do is check the intraday reading after the lunch and, if that represents a spike from current levels, I will consider this condition met.

This plan is highly dependent on good GDP data. I will not chase the market if it gaps down and does not rally. In this case I think that there will be another opportunity to sell next week.

Thursday, January 27, 2011

A Question of Timing

I think we are very close of an intermediate term top in the market. Here is why, mainly:

> the pace of change in retail sales will slow down, usually consistent with weak future economic data and a correction in the markets :

> Gallup daily consumer confidence is at a high for some time. This preceded corrections in the past:

> breadth indicators (NYHL, % of stocks above the 50 DMA) that are diverging from the market. They usually do this and the market keeps rising but this is eventually followed by a correction.

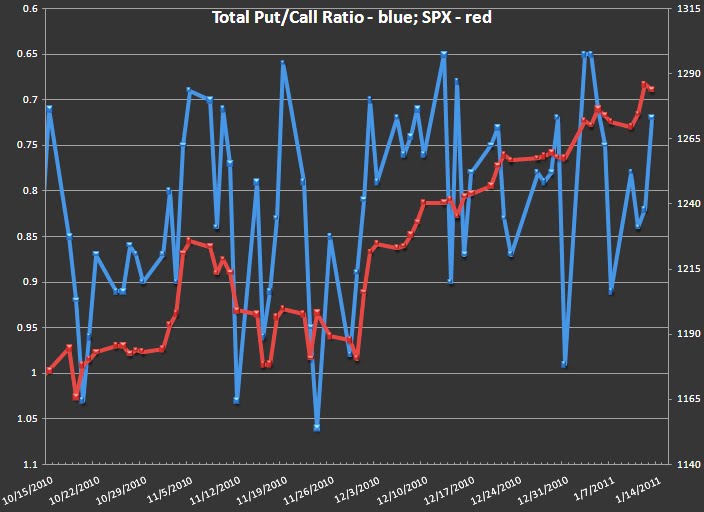
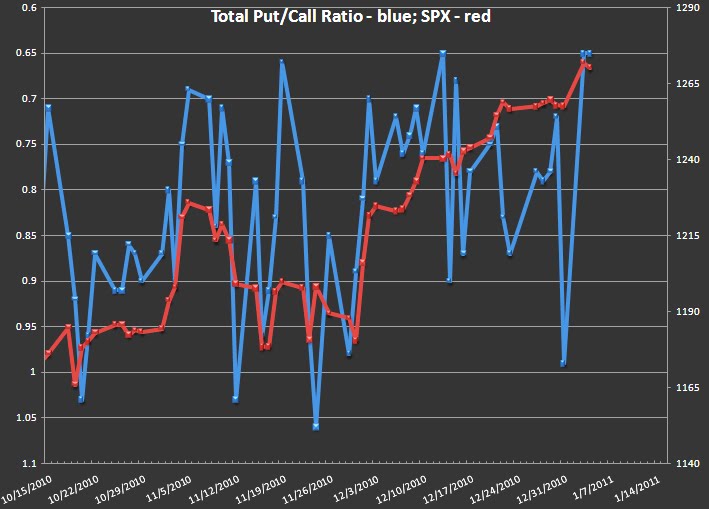
In this context, the only problem is timing the top. For this purpose, I use put/call data and expect a turn around important economic reports:

> I think the next bullish spike on the cpc and the 5 day EMA reaching the overbought line will offer a good opportunity to sell:

The put/call ratio is very weak with the market at new highs. This is normal behavior at more important tops

The 5 day EMA of the put/call ratio will probably give a sell signal once it approaches the overbought level today or tomorrow.

> Tomorrow the Q4 GDP number is reported, a very important economic data point, one that marks inflexion points in the stock market.

A good way to minimize risk will be to wait for the market to rise significantly before an eventual short. I think this will happen at the open tomorrow after good GDP data.

Wednesday, January 26, 2011

St Trading for Jan 26th

The market really insisted yesterday that I cover my longs before it rallies. Very unfriendly behavior!

The recent market behavior is not a good sign however, and the higher volatility will continue after today's important announcement. Normally, I would have expected a top today but the put/call ratio is oversold:

This suggests that a more important top will be made instead around the GDP number on Friday. The market may keep rising until then since expectations for Q4 GDP are positive.

Tuesday, January 25, 2011

ST Trading: Out at 1279.75 ES

The market is very weak after the lunch.

Still Holding My Longs

I am ready to sell if the market weakens again:

A drop below 1282 SPX would make me give up. Otherwise, the early sell off is just the shake out I was expecting yesterday.

ST Trading for January the 25th

The market has traded above 1290 overnight but it is now, quite surprisingly, for me, around 1284 in spite of yesterday's behavior and close. However, if it does not go below 1282 after the open, the cup & handle pattern on the SPX is still valid and there is a big chance of renewed buying until tomorrow.

The put/call ratio has barely moved yesterday with all the upside in the stock market:

This suggests that bears are still looking for continuation of the last week's drop, a bullish event for the next 2 days of trading. In this context, if the SPX starts moving up and closes strong above the 7 h EMA, I may add to my short term longs. I do not expect the put/call ratio to be very strong or even reach overbought as this is the normal behavior before a bigger correction.

Monday, January 24, 2011

Target

Possible cup & handle pattern projecting to 1300 SPX:


ST Trading: Long @ ES 1284.5

A little too risky as the close is near.

Missed My Entry

My plan was to enter the market, if it does not come to me at the open, as soon as it closes strong on an hourly basis above the 7 h EMA. Missed it! The first pullback to the EMA will represent the next opportunity to go long, unless it comes too late into the session.

ST Trading for January the 24th

The put/call ratio has spiked from oversold but it has some way to go until overbought again:

With the Fed announcement on Wednesday afternoon, I think the ratio supports an advance to 1300 for the SPX.

I have drawn the expected path below:

A sell off today at the open, to around ES 1275, will represent a good buying opportunity.

Longer term, I think the IT top is starting to take shape. Last week was volatile and I also expect to see weakness on the next rally.

Friday, January 21, 2011

ST Trading: Covered Long @ 1284.5

ST Trading for January the 21st

Yesterday's multiple exiting and entering in positions is due to one minor event that kept me away from my desk for the first 15 minutes of trading. It caused me initially to miss my planned entry at ES 1271.5 and to buy much higher (1274.75). I then tried to adjust but I just could not get away without a loss.

The total put/call ratio is still oversold:

This suggests I should keep my long position until I see at least a big bullish spike. As soon as my target is reached today, I will check out the cpc intraday reading and cover only if I see the spike. I think the market will reach at least the recent highs next week but there will also be a steep drop at the close today or on Monday as the bears will try to sell in the wake of the recent big decline.

Here is in more detail why my target is at SPX 1286.5:

This kind of analysis is inspired from Carl Futia's blog.


Thursday, January 20, 2011

Target

ST Trading: L @ 1270.5

Sold all longs @ 1270.5

ST Trading: added to Long @ 1271.75

ST Trading: L @ 1274.75

ST Trading for January the 20th

Yesterday the market changed its uptrend behavior: after the lunch it traded to new lows for the day and mostly stayed there. Also, the correction is already 17 points, greater than the usual 15 points. I think this, in the context of previously presented behavior of other indicators, suggests the IT advance is mostly over.

However, judging by the put/call ratio, the market participants are quite bearish in the short term:

With the Fed meeting next week, I think the market will start going up in the following days. My bias for ST trading will be bullish with caution, since I expect the advance to be shaky.

For a buy point, I like a break of 1274 today or even lower, depending on where the market opens.

The first support in the way on the SPX hourly chart is around 1277:


Wednesday, January 19, 2011

ST Trading: Covered @ 1280.75

The market started to rally after coming close to the target.

Gain: 3 points /normal postiton

Target

SPX hourly chart

Or, cover short on a small pull-back after a strong hourly close above the 7 h EMA.

Why Short

The market is ready for a correction:

When the 5 day EMA of the total put/call ratio makes even the slightest turn from overbought, a correction usually follows.

Also the market breadth is weak by some measures.

I had two options: sell on an initial rally or, if it does not happen, sell on a first hourly strong close below the 7 h EMA.

Stop loss is above the recent highs.

ST Trading: S @ 1287

Update

Late post today

Tuesday, January 18, 2011

ST Trading for January the 18th

Short term

When the market goes parabolic and I do not have a position on, my first instinct is to go against the trend. It is the same today. Also, usually, after a strong move up and a long week-end, a big gap up is a good short.

With the put/call ratio deeply overbought this trade looks good. However, I think it is going to work only for the first part of today's session. The market rarely goes straight down after going straight up. Since my time frame for ST trading is a few days, I will have to let the market settle first.

Longer term, breadth indicators are still diverging from the market as they usually do in bull markets. It is anybody's guess when the market breaks down. My guess is that it will start to happen this week with increased volatility. Another push higher will probably mark the IT top.

Monday, January 17, 2011

Spikes

By the looks of it, there will be another push higher after an initial correction this week. The Fed meeting and GDP report in the last week of January look like the perfect occasion for an intermediate term top.

Friday, January 14, 2011

Stopped out @ 1285.5

I was not able to post in real time.

Loss: 1.75 points / normal position ( this was a short against an uptrend and i used half the normal position).

ST Trading: S @ 1282

Update: Stop loss is at 1285.5.

ST Trading for January the 14th

ST Trading

The put/call ratio is set up for a short today.

With the recent rally being 25 points long and several IT indicators suggesting market weakness, I will go short for a move of about 15 points.

However, the market seems to be rolling over already. I initially expected it to open with a gap up that I would sell. Since I am being selective on the short side in an uptrend, I will wait until after the 10 am data to sell. If, by that time, it does not rise above 1280, I may postpone shorting. I will also use the 7h EMA as a guide, an hourly close below it signaling the top has been made.

Longer term, I think the market will correct until mid next week and then start moving up again until the Fed meeting in the last week of January. I expect an intermediate term top around that time.

Thursday, January 13, 2011

ST Trading for January the 13th

I am expecting a move down in the stock market, especially since the latest rally is about 25 points long, as much as other rallies since December. However, after yesterday's strong up move I expect weakness to be bought today.

The p/c ratio does not favor a short yet:

It will be supportive of a short tomorrow if the closing reading will be the same as the intraday at this moment.

I also like a short tomorrow since heavy economic data is to be reported. Expectations for the data is positive and this usually leads to a spike at the open that can be sold.

Short Term Trading

In the chart below I described the way a typical trade of mine goes. The idea is to time the IT moves in the direction of the long term trend in the economy and stock market.

Given the fact that I am able to monitor the market on a daily basis, I recently decided to add a new type of trading to my arsenal. I will call it ST (short term) Trading.

The main idea will be to take trades in the direction of the IT trend and try to time the mini-corrections along the way. I will use a full position when going with the trend and half a position when going against it (I will be very selective in this case).

In general I will use my experience and indicators to determine the market bias for the next 1-3 days. I will take trades in the direction of this bias. When I am not sure which way the market is headed, I will go with the trend if it starts to move in that direction. The 7 hour EMA will be a guide in this case. Any move passing this EMA in the direction of the trend will generally trigger a trade. Here is an example:

The important thing to note is that I have little experience with this kind of trading and thus I do not know the expectation of this trading strategy. I will determine it along the way.

The trades will be posted in real time on the blog. Please, do not try to replicate them in your accounts. Rather use them as a way to develop your trading by taking a different perspective.


Wednesday, January 12, 2011

Bull Legs

On this S&P chart starting in 1988 I highlighted each bull leg. I considered to be a bull leg any rally that started/ended after/before a 7% or bigger correction.

Will the last one (boxed in red) be longer than 23%?

Given that the only bull legs longer than 30% were either at the base of a bull market or during the '90s, I will assume this one will stop in its 20s.

Tuesday, January 11, 2011

15 Points Corrections

The rally that began in December corrected 15 points before going higher 2 times. It seems it is going for the 3rd:

Yesterday I thought this pattern would be broken but in bull markets the path of least resistance is always up.

However, weakness is more and more evident. The VIX usually diverges from the market before bigger corrections:

This along with other evidence makes me hold my belief that we will see a bigger correction very soon.

Monday, January 10, 2011

Analogy

Here are two previous cases which hint to what today might eventually look like:

> July 2010
> August 2010

In both cases the market sold off after a small range day and a first attempt at selling off.

The market looks similar now:

A big gap down at the open today would confirm the assumption of a trend day down.

Friday, January 7, 2011

Go Short?

Here a very reliable signal of a top: the turn in the 5 day ema of the total put/call ratio.

This signal given before the employment report with everybody having positive expectations (amplified by the ADP number yesterday) is not a good mix for the short term longs.

With other indicators suggesting bigger corrections, even the intermediate term longs are in a bit of danger:

> Gallup Consumer Confidence (previously commented on here):

> 3 month average of the monthly percent change in real retail sales (last analyzed here):

Will I short?

The thing holding me off is the expectation of a good retail sales number for December which would prolong this rally a couple of weeks. There is little excuse for losing in a bull market on the short side because you simply should not short a bull market.

However, the market is nicely set up for a top around these levels and if ES rallies after the open above the recent high at 1277 I may give it a try and go short.

Thursday, January 6, 2011

Close to a Top

The market has started to be shaky (moving violently up, then down, then up again) before an important event: the employment situation. This suggests a bigger correction will follow with a top today or tomorrow. The pc ratio will probably form a pattern often associated with tops:

If today gaps up strongly, the more aggressive can short around the overnight highs. The employment report tomorrow does not represent a big risk for the shorts with the market already this high. The more conservative way of shorting would be on an initial spike up after tomorrow's report.

I think that after an initial correction next week, the market will go up again into the retail sales report. I expect an intermediate term correction after that.

Wednesday, January 5, 2011

Outlook for the Short Term

With the market still overbought at yesterday's close, today is very probable to sell off hard and close at its lows.

This correction may end after about 25 points to the downside around the 20 DMA. From there I expect the market to start going up again but be weak. Here is how things might unfold before this bull leg ends:

The above is market action from Jan - Feb 2007.

If conditions seem right, I will go long after such a correction. As usual, I will mainly time the trade using the total put/call ratio.

Tuesday, January 4, 2011

Market Outlook

Yesterday the market was weak after lunch time even if, earlier in the day, the ISM number was strong. This suggests yesterday was more of a capitulation day than a break-out.

Judging by the big spike, the total put/call ratio also suggests the bears have given up:

With SPX 1270 touched, the expected spike in NYHL which is still showing weakness and the diverging 5 day EMA of the total put/call ratio reaching again the overbought level, the market looks ripe for a bigger correction. The employment report may mark this inflection point.

> NYHL (52 weeks New Highs - 52 weeks New Lows):

> 5 day EMA of the total put/call ratio:

Monday, January 3, 2011

Happy New Year!

The market is lifting the ball nicely today for a possible short. Patience pays indeed!

Even if the market is ripe for a correction, I will refrain from selling for two reasons:

> The total put/call ratio:

I have previously seen the market top with the ratio spiking like this but I like to fade bullish spikes especially when I go against the trend.

> The bullish outlooks for the economy have reached everyone's ears by now and I think the majority of market players expect a positive surprise from the NFP number on Friday. This means they will buy or postpone selling until then.

These reasons in the context of a strong uptrend make me stay on the sidelines for now. For those that choose to sell, a rally into ES 1264 on the ISM number looks tempting.