Sunday, October 31, 2010

Market Outlook For Next Week

I will not be able to post on Monday and will probably be back on Tuesday.

The market is waiting for next week's important events. I think it will have an upward bias until Wednesday when the "sell after the Fed" trade might work again - 1200 looks reachable. I expect it to close down for next week and attempt to rally again the week after.

My guide will be, as usual, the put/call ratio:


Friday, October 29, 2010

GDP

I think the GDP report reflects the ongoing process of the consumers taking over some of the growth burden from the business sector. Thus, the consumption data shows some increased positive contributions (services consumption is coming back to life) while businesses made smaller contributions than before or even negative ones.

This process is what worried Mr. Bernanke according to his recent speeches. Since it seems to be happening, it may lead the Fed towards a more prudent stance regarding the new round of QE.


Market Outlook for Friday

I will write a quick post later on the GDP report. Right now I have to run.

I am still expecting an upmove until next week and I think it will start today. The put/call ratio however is not giving a buy signal:

Nevertheless, if the intraday reading for the ratio is in oversold territory after the lunch, I will consider going long.

Thursday, October 28, 2010

FSLR Q3 Report

First Solar (FSLR) is one of the three companies I keep very close track of. The other two are Apple and FedEx. I focus only on such a small number because I do not have an army of analysts at my disposal. I try to choose significant companies and only replace them rarely.

FSLR is due to report today for Q3, ending September 2010. Here is an analysis of its sales growth rates compared to year ago levels:

Usually the sales growth slowdown by about 50% signals trouble ahead, like earnings disappointment. Notice how, starting from 2008 and until the current quarter, the growth rates dropped by at least 50%. No wonder the stock hasn't been doing great during this period:

FSLR chart, 2008 - today


The values for q3 (green) and q4 (red) are estimates from Yahoo Finance. Q3 is estimated to grow at a good rate compared to q3 last year but in q4 2010 the company is expected to register a drop in sales compared to q4 2009! That is a clear red flag and it makes FSLR a good candidate for a bearish portfolio.


Media Too Bearish For a Top Yet

I am stunned by the resilience of the bearish sentiment despite the fast rally from 1040. Here are just two examples: today's most popular articles on MarketWatch and WSJ Markets section.

- MW:
- WSJ:

Scepticism towards the economy and the rally is at the top. There is also a lot of scepticism towards the new round of QE.

If sentiment continues to stay like this the market will just bounce back up after each small correction. Usually what flushes this bearish sentiment is a bigger correction followed by marginal higher highs. I think this will be the path after the Fed meeting on Wednesday.

Wednesday, October 27, 2010

Market Outlook

The put/call ratio is not oversold yet:

Since the ES is trading back in the 1165-1180 range, I will assume a move to the lower boundary is in the cards. If it happens and if the put/call ratio spikes down on my chart, I will be a buyer.

I think the GDP report on Friday has to be taken into consideration too. The market may start rising only after this report. This would leave 4 trading days for an upmove into the Fed announcement which seems enough for the market to reach 1200.

Tuesday, October 26, 2010

Market Outlook for Tuesday

It's been quite a while since I have seen new lows for the day after the lunch and a weak close. The market has broken out of the range but does not seem to gain momentum on the upside. As I am writing this it is retesting the upper boundary.

The put/call ratio is not very suggestive regarding a future path for the spx:

It has been oversold, but the bears seem to have given up judging by the spike up (on my inverted chart). Yesterday's selling didn't move the ratio very much.

This is why today I would not be surprised by a fall back into the range. This might allow the market to recharge batteries for the move up until next week.

Monday, October 25, 2010

To Fight or Not to Fight the Fed?

Beginning in August the Fed has altered its stance towards the economy. First, they changed the wording and then, most probable on the 3rd of November, they will proceed to more quantitative easing. Meanwhile, the stock market has registered bear market readings on the May-June sell off that are consistent with the end of the 09-10 bull. Can the Fed resuscitate by its actions the dying bull? As a longer term trader, to fight or not to fight the Fed this autumn, as this rally becomes overbought?

For a possible answer I looked in the past, at a similar case. I will also highlight the differences to nowadays at the end.

In August 2007 the markets were coming after a sell off induced by bad news related to subprime mortgages and a slowing economy (purple ellipse below):

The inflation was also moderating (purple ellipse):


Consequently, in August, after one regular and two unscheduled meetings, the Fed signaled a change of stance: they started to worry more about economic growth than inflation. Usually, this means rate cuts, which happened in September and end-October. The markets started to rally:

Also, what is interesting is that on the August 07 sell off the market registered bear market readings, in the same fashion it did this summer. What happened to the market after the end of October meeting is history. It seems that fighting the Fed was the way to go in 2007.

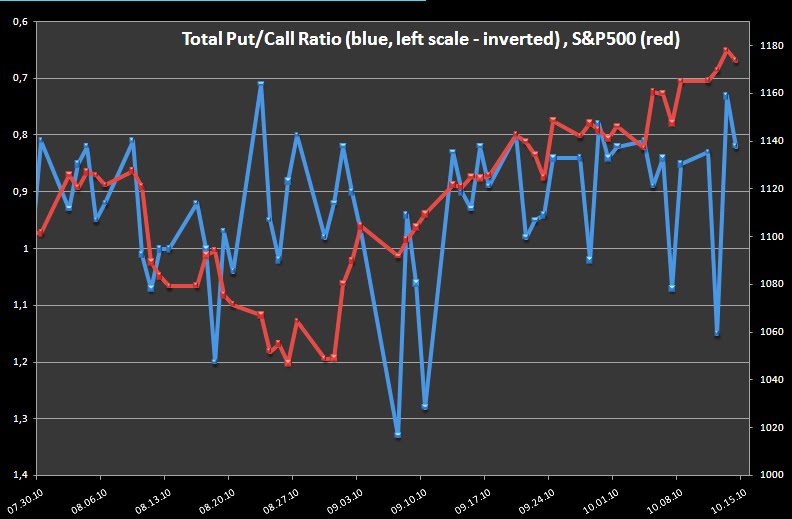
The similarities to today are multiple. First, the economy and inflation slowed down (red ellipses in the first two charts). This, coupled with bad news regarding sovereign debt, has taken the market down. In August the Fed changed its stance, showed it meant business in September and at the beginning of November is ready to go further and act. Second, the market entered technically in a bear market and has rallied since the Fed changed gears. Here is the chart:

What to do? The answer is pretty clear given the analogy. The November '10 meeting corresponds to the October '07 meeting and it is the last thread the bull is hanging on. If the bear is here to stay longer, the market should really change its behavior after this meeting.

Can it be different this time? It can, because the expansion cycle is still young compared to 2007. It is much easier to resuscitate a young patient than an old one. I am still ready to bet on the downside but will listen to the market especially after the 3rd of November.

Friday, October 22, 2010

The Canary in the Coal Mine: European Consumer Confidence

The chart below shows the European Consumer Confidence index -ECC- in red and the US Consumer Sentiment index - USCS- in green.

I first analyzed these series here. The ECC made a new high and the USCS stayed weak as expected.

Notice that recently the ECC has turned downwards. This was a signal that accompanied major tops for the stock market in the past (black circles) - 2000 and 2007. It seems that after divergence between the two series (purple segments), as soon as the ECC turns, the stock market tops.

I have also highlighted two cases in which the signal did not work (red rectangles). An indication of the signal being a fake was in both cases a move to new highs (black segments) by the ECC accompanied by strength in the USCS.

Thursday, October 21, 2010

Market Outlook

Here is the range I expected to contain the market this week:

ES chart, Oct12 - Oct21

However, I also expected the market to trade near the lower boundary by today or tomorrow and offer a buying opportunity. It does not seem to happen.

The put/call ratio has become more oversold, despite yesterday's rally:

Usually, this would imply immediate higher prices, but this time the gap up may be enough to flush the bearish sentiment. I still expect a move towards the lows of the range before a break out to the upside.


Wednesday, October 20, 2010

Market Outlook

I think the put/call ratio may be considered oversold, or close to oversold. It has moved about 0.2, about as much as in previous cases.

This makes me think that the 1165 level on the SPX will not be breached on the downside before the start of the new leg up. A buy opportunity will emerge by the end of this week. I expect a move above 1185 SPX that will last until the FOMC meets at the beginning of November.


Tuesday, October 19, 2010

Market Outlook

Since the put/call ratio does not seem oversold, I have to repeat myself and say the correction is not over. It can even be argued that it hasn't even started yet.

The market will probably look like range bound in the1165-1185 interval by the end of the week. I think that the ratio will drop some more on my chart and offer a good opportunity to go long into the Fed meeting.

Monday, October 18, 2010

AAPL Quarterly Report

Apple is due to report earnings today after the close. Here is how I quickly gauge the probability of a negative surprise:

Since earnings come from sales, a first sign of a weak report would be the annual rate of growth of quarterly sales slowing considerably. In the table above the red numbers are the latest sales estimates from Yahoo Finance. The purple ones are the year ago figures.

The rate for q4 this fiscal year (53.6%) is roughly equal to the one from last year (54,6%) suggesting that there is no reason to expect a bad report. The same holds true for q1 of the next fiscal year (green rectangle).

These estimates are available long before the day of the actual earnings release. Thus, a portfolio can be built in anticipation, centered on the stocks that have good odds of meeting or beating their estimates.

Out @1177.5

No sell off, but, I think, no upside breakout today either.

Short Again @ 1174.75

Out @ 1176

Short @ 1072.5 ES

Downside Not Over

The put/call ratio is still suggesting there is more downside to come. Today, selling on an initial rally would offer a good risk/reward proportion. I expect a move to about 1150 this week.

Sunday, October 17, 2010

Market Outlook

I said previously that I had expected a bounce in the economy this autumn. It has happened (red ellipse):

I also stated that the fall would start again after this bounce (green line), following the behavior of the series in the autumn of 2007 (purple ellipse). Why fall again when this expansionary cycle is just one year old? My answer is, in short, that the adjustment in the economy is not finished. My thesis would be invalidated by the above series moving higher, say above the 0.5 level (although I do not think this will be the case, I always try to keep in mind possible evidence that would prove me wrong as soon as possible).

Meanwhile, the stock market has registered bear market readings as it sold off this spring-summer. As a consequence, the rise to current levels may be considered a bear market rally. The latest development on this front is one of my favorite indicators ( 5 day ema of the put/call ratio) becoming overbought:

Notice how it has reached the horizontal green line, a level where it stopped as previous bear market rallies topped (red circles). Normally this would be a clear sell, but I do not think the markets will sell off before the FOMC meeting on the 2nd & 3rd November.

I think next week we will see a correction or sideways action, followed by a extension of the rally into the Fed announcement. Depending on how things line up by then, a great long term selling opportunity will be at hand.

The above will be the framework I will work with during the next weeks. I will do a post focused only on evidence against this framework, evidence that would make me change my mind. This will be like a stop loss for a trade - an indispensable tool for any trader.

Friday, October 15, 2010

No Rally, No Sell

The market was not kind enough to lift the ball so I can hit. It feels too risky to chase it on the downside.

Quick Update

The market is behaving as expected with the futures up after the speech and economic data. The dollar is rising, as a cause of the better than expected retail sales report (it means less QE). The CPI release is not something to make the Fed change their mind about QE but the pace of change has risen on average for last three months.

I still think the correction has not ended and will probably short on a rally after the Consumer Sentiment data. My preferred level is above the recent highs at 1181 ES.

Outlook for Friday

The put/call ratio suggests the bullishness has not been flushed yet:

Thus, the correction is not over.

I expect the economic releases today to be positive, which, along with Ben Bernanke's speech, may push futures up at the open. However, I think this will represent a low risk opportunity to sell. If I go short, I will use small size since, given the recent rhythm of the market, selling does not seem to be very profitable.

Thursday, October 14, 2010

Time for a Correction


The market is ready for a correction. I think most of the early shorts got burned and gave up. The put/call ratio spike (chart above) is suggesting this, but also the high volume registered yesterday:

The high volume and the weakness into yesterday's close are also indications of bigger traders taking profits.

I think today's strength can be sold for a quick profit but, since tomorrow is a very important day, I will wait and see what happens. In case we get a correction, I think it is high time we saw some bearish themes play out, like the dollar correcting its recent downfall, otherwise this bear seems ready to grow horns and put a tail on.

As I said before, data released tomorrow is important for the Fed's outlook on the economy. If it comes in positive it will be interesting to see how the markets trade until the next FOMC meeting.

Wednesday, October 13, 2010

Market & QE Outlook

The markets are continuing their march upwards. The DAX has broken out to new bull market highs. It seems investors really like what the Fed is saying.

Will the Fed really go ahead with QE? The November meeting might provide more clues. Meanwhile, we can get some insight from Friday's CPI and retail sales numbers. I expect them to reflect accelerating inflation and an improving economy. This might tilt the balance inside the FOMC towards a more prudent stance.

The put/call ratio is indicating extreme bearishness:


I think yesterday's bears will have to cover at a loss at the open today. The market might fall afterwards and approach yesterday's close. Strength will probably be back after the lunch.

Tuesday, October 12, 2010

Market Update

The SPX has almost reached the 1170 upper target provided using the Fibonacci levels:

This, coupled with the put/call ratio spiking up, warrants some caution:

However the bears will probably be disappointed again. I think the market is in the process of building the confidence of the bulls so, what will look like the start of a bigger correction will be quickly reversed to the upside.

Monday, October 11, 2010

Market Outlook

Here is an update of the chart I recently presented:

The SPX is blue, the ratio of cumulative monthly advancing versus declining volume is red. The ratio has turned up (green circle) and it will reach the horizontal red line soon. I think this move will be accompanied by a rising stock market.

The next significant correction will probably happen after the retail sales and CPI reports on Friday. These two reports as well as the consumer sentiment release and Ben Bernanke's speech make this a pivotal day. This is when we should start seeing more bearish signs in the markets.

Friday, October 8, 2010

Looking to Go Long

The put/call ratio is suggesting more upside to come:

Note the bearishness despite not too much downside lately. I tried yesterday to go long but failed. I will try again today if offered the chance. My favorite level given the pre-market action is 1149 ES or 1154 SPX. The employment report, however, may change all this. I will try to adapt depending on market behavior.

Thursday, October 7, 2010

Out at 1148

Long at 1153.5 ES

I will get out under 1150 or if the market does not rally after the lunch

Some Perspective on the Rally

The following chart is that of the ratio of the monthly cumulative advancing versus declining volume:

The SPX is blue, the ratio is red. This is an indicator inspired from Will Rahal's insightful blog. Its behavior is one of the reasons I think we are in a bear market.

Notice how at the beginning of the previous bear market (2007) the ratio reached the lower horizontal line; it has done the same after this year's spring swoon. The indicator then becomes overbought at or below the upper red horizontal line (green circles).

If we are in a bear market, this time around should be no different. I have drawn in black what I think is the most probable future path for the indicator. It suggests more upside to come for the stock market in the very near future. How much upside? In September 2007 the same move for the ratio meant about 4% more on the upside for the stock market in about 3 weeks before the top was in. We'll see how it unfolds this time.

Wednesday, October 6, 2010

Rhythm of a Bear Market Rally

I have stated before that I was working in a bear market context. I still do until the conditions described at the end of this post are met.

If I were to take the previous bear market (07-09) rallies as a guide, I would expect steep corrections to punctuate the current one as soon as the market becomes overbought. However, it doesn't happen; corrections are small in length and duration.

So I looked to the 00-03 bear for more info and I found that bear market rallies can go up without big corrections:

- April-May 2001:

- September-December 2001:

In conclusion, nowadays market behavior is not unusual. The market can go up in a sustained rhythm. In fact it usually does reach levels beyond the expectations of the average bear.

This is why I do not like targets. I usually monitor the condition of the market as it moves and determine when it is time to act. For now, it is not there yet but it is getting close.

Tuesday, October 5, 2010

Covered the other half at 1150.50

Covered Half the Short Position at 1149.75

stop for the other half at 1155 ES

Correction Not Over

The market has broken out of the range yesterday, but the futures are trading back into it as I am writing this. However, I think the correction is not over. The put/call ratio has not spiked down on my chart. Until it does, I am going to bet on the downside.

A significant level to watch today is 1141 on the SPX (~ 1137 on the ES). This level supported the range lately:

SPX 30 min chart, last 7 days

I expect it to act as strong resistance today.

Monday, October 4, 2010

Sunday, October 3, 2010

Taking Monday Off

I will not be able to post or watch the markets for the most part of Monday's session. I will be back at it on Tuesday.

I am still holding my short position. I think everyone is tired after a full week of range action and on Monday there is a big chance of a break-out.

Friday, October 1, 2010

Stops

Half the position at 1149 ES, half at 1155 ES

Don Miller, Trader Extraordinaire!

I think this is the best free video about the right approach to trading. It is centered on yesterday's action:


He is talking about day trading but I think the same approach can be taken to longer term swing trading. The difference is managing the risk of holding positions overnight. This is why, if I add to a position, I do it mostly before the lunch and get rid of it if it doesn't go significantly my way until the close.

Meanwhile, the market reversed nicely yesterday. Still, the put/call ratio has not fallen (on the inverted chart) too much, suggesting there is still more downside in the cards:

The fact that the market has been in a range for four days now with a massive failed upside break-out attempt (yesterday) portends a steep correction. Also, as always, defense has to be prepared for the worst. In this case, I will start exiting my short if the SPX breaks and holds above 1150.