Wednesday, October 26, 2011

Not a Bear Market Anymore

I did not have too much time to post lately. In fact, this will be the case from here on and I am thinking of discontinuing this blog or post much more sporadically.

Meanwhile, the so called bear market rally has metamorphosed into something else, invalidating my long term expectation of a bear market. Here is a reliable indicator suggesting the move up in October has been more than a bear market rally: percent of S&P500 stocks above their 50 DMA.


The purple line usually contains this indicator during bear market rallies. Notice the recent strength above the line.

This is not the only indicator suggesting the same thing. So, from here on I will buy daily pullbacks, at leat until the 5 day ema of the total put/call ratio moves towards the upper part of my inverted chart below. In fact, I already bought today at the 1216.5 daily ES support.


Wednesday, October 5, 2011

Covered Long at 1117.5

I missed the exit at 1123 and the rally above 1120 is failing.

Down, Then Up

Nice move up yesterday but, looking forward, today the market may fall back below 1100. Here are some previous cases of strong one day reversals and what happened after them.

The pattern is down today and up again starting tomorrow. The only time this pattern failed is when the day after the reversal opens with a big gap up. Today, this will probably not be the case.

The NFP report on Friday might also deter buyers, since recent numbers have been quite bad.

Thus, I will take profits on my longs on a rally, even before the US open, if the market rises back to 1123.

Tuesday, October 4, 2011

That's more like it!

A 50 points rise in the last hour of trading must mean something. As a side note, that usually happens in bear markets.

Still, given the very strong close, a trend day down tomorrow is not excluded, but, generally, the market is headed towards 1250 over the next weeks.

Long again at 1081.5

Out at 1076

the market has been very weak after the lunch. There is a possibility of a last minute surge but the downside is too menacing

long at 1079.5

Turnaround Tuesday?

I am a little tired of buying this falling market. The fact is that I did not know where the fall would end. It might have ended on Monday, or make new lows and the bear market rally thesis would still have been intact.

However, the moment of truth is very close. I still think that a big multiday rally is just around the corner. The Ben Bernanke speech today might offer some excuse for such a rally.

In the mean time, here is a similar situation from 2010. The market rallied after making new lows, but it took a few days.

Back then the bottom took place a few days before a NFP report. If today will prove to be a turnaround Tuesday, we may finally see the bottom.

Monday, October 3, 2011

Out at 1100.25

The market refuses to rally today. Maybe it will do so tomorrow after a break of the August lows

Long at 1105.75

last try for today

Out at 1115.5

The market is very weak. If a low is formed today, it will happen from 1107 or even 1195

long again at 1120.5

I do not want to be left behind. This time, I will exit at a loss only after a 30 min close below 1114.

out at 1118

Strength was sold.

Long at 1121.25

Fuel For The Next Rally

The Chinese PMI is turning from the lower bound of its interval of variation. I think this will be associated with some economic activity acceleration in the US over the next several months. This will support the equity markets before the next leg in the bear market.

With the stock market near the lows of its recent range, I will look for long entries today and/or tomorrow, keeping in mind that a low may be marked by the NFP report on Friday.

Wednesday, September 28, 2011

Out at 1156.75

If the lunch weakness was reversed on Monday, today wasn't the case. "The market giveth and the market taketh away."

Long at 1171

The market is strong after touching support at 1162.75

Out at 1168

I will try again around 1160

Long at 1174.5

I was hoping for 1160 but the support at 1170 (yesterday's close) seems to be holding

Ready to Reenter Long

Now that the danger has been averted and the market did not fall further, I will look to reenter my long today. The 3 day fractal, of which today is the second, may play out like this (May 2008):

There is a high resemblance between the market action and closing hour on yesterday and on the 14th of May 2008, the first day in the fractal highlighted above.

Another factor suggesting a continuation of the rally is the vote in the German parliament on the EU sovereign debt rescue plan. The market will most probably rise in anticipation.

Tuesday, September 27, 2011

Covered Long at 1175.5

The market is very weak near the close and this is very unusual given the strength up to here.

Monday, September 26, 2011

Sunday, September 25, 2011

Bear Market Rally Still Not Over

The market is in a bear market and is starting to fall very fast, but I still feel like looking for longs, playing a continuation of the bear market rally. This is not just gut feeling, of course. I have shown two indicators in my last post suggesting that the market has not been overbought and that the economy has some positive news to provide.

Back at the beginning of August I was thinking that the FOMC meeting will mark the end of the rally. The Fed has failed to deliver, indeed, but the market technicals are not aligned for a new downleg. I now think the market will be supported by the anticipation of some positive outcome in the European crisis over the next weeks. All until the first advance estimate of the Q3 GDP comes at the end of October - maybe we will get an answer as to whether the anticipated economic acceleration is taking place. I expect this event to mark the top of the bear market rally.

Meanwhile, I will start to go long next week, whenever conditions are favorable. In fact the first opportunity to go long presented itself on Friday but it would have been too risky to hold longs over the weekend.

Given the way the daily chart looks right now, a marginal brake of the August lows cannot be ruled out, before the move towards 1200 starts again. I personally do not have any clue to tell me if that will happen or not. I will leave it all to chance and let risk management do its job.


Tuesday, September 20, 2011

Covered Long at 1211.25

I am not sure that the market will reach my initial target of 1223 ES. I am leaving just a third of my initial position to run further.

Analogy

Here are a few analogues from 2009-2010, with the candle corresponding to yesterday's trading circled in green.


In two of the cases, the market was two days before a FOMC meeting., just like today.

This suggests that the market may correct starting on Wednesday, after a move up today. The strength is not guaranteed for tomorrow too, given the analogues above and with the SPX hitting the 50 simple DMA around 1225. Thus, I will take profits today if the market reaches 1223 ES.

Looking further, the bear market rally will continue after a few days of downside. The 5 day ema of the total put/call ratio is far from overbought ...

... while the economy has some positive surprises coming first.


Monday, September 19, 2011

Long at 1190.5

The market is strong after a bigger correction. I think strength will last until Wednesday afternoon.

Wednesday, September 14, 2011

Out at 1166.5

The market does not seem to be holding strength. I think it can head lower today and start rising again tomorrow.

Tuesday, September 13, 2011

Long at 1159

Yesterday's rally did not fail, so I have to go long again.

Covered Long at 1148

I expect a fast sell off today towards 1130 (December contract). This is what happens with reversals from oversold that go too fast too far. Here are some examples from 2010:


Monday, September 12, 2011

Long again at 1137.25

The market is acting strong after the lunch.

Covered Long at 1138.5

This rally looks like it is going to fail. I will try again, most probably tomorrow.

Long at 1134.25

December contract

Still Bullish

Patience and luck have kept me from buying on Friday. These are two essential ingredients for successful trading, although only one can be controlled by the trader himself.

I am willing even to push my luck, given that I am now in a much better position to risk money on the long side, since, if my bullish bias is still right, most of the downside has already come to pass.

The put/call ratio suggests the market is oversold and ready to bounce. The Fed meeting next week will attract buyers this week, or, at least, will deter sellers.


I think anything today around or below 1335 ES (December contract) is a good price for a long position.

Friday, September 9, 2011

Bullish

I think the market is heading to new highs for this bear market rally. I will look to buy today in the 1180 zone. If the market does not hold this level, the sell off might continue deeper toward 1160.

The total put/call ratio made a "bearish spike" yesterday, supporting the bullish scenario.


Friday, September 2, 2011

Bear Market Rally Not Over

I saw some comments throughout the online financial media stating that the bear market has probably made a swing high this week and that we should look for new lows from here. I do not agree. There is no intermediate term indication of an oversold market.

Here is one indicator, the cpc 5 day ema, which is still depressed. It will have to reach close to the upper horizontal line before a top is made.


Until then, deeper pull-backs lasting a few days are buying opportunities.

Thursday, September 1, 2011

Covered at 1224.5

Short at 1219.5

Covered at 1213

I will look to short again after the US open. For now, it is time to bank some profit while the market gives it.The market will probably only break down after a "bullish spike" in the total put/call ratio.

Wednesday, August 31, 2011

Short at 1225.75

This is not a trend day so the market is not breaking higher. I am looking for weakness in the second part of the session to hold this position.

The Poem for a Shake-out


[...] some unhappy master whom unmerciful disaster
Followed fast and followed faster till his songs one burden bore -
Till the dirges of his hope that melancholy burden bore
Of "Never-nevermore."'

Fragment from The Raven by E.A. Poe

------------------

Still, I am not saying "nevermore" and am ready to short again after a probable lunch rally, if everything looks right.

Covered the entire position at 1224.5

The market looks strong

Added to Short at 1219.75

This is my last add. If the market stays strong above 1220 today, my trade idea is invalidated. Until then, the market is very generous with this extended rally.

Tuesday, August 30, 2011

Added at 1210

Short at 1205

might be a little too low but the market turned from near 1210. I will add if it goes to 1210.

Ready to Short

I am looking for a short after the FOMC minutes at 2:00. The market is already stretched to the upside and the ISM data on Thursday will most probably be anticipated by the market by dropping, given the ugly regional surveys already available from Richmond, Philadelphia and New York (Chicago is reported tomorrow).

1213 ES is my favorite level, but I would take anything around 1210.

Monday, August 29, 2011

Choppy

Bear-market rallies are usually choppy. The market can do anything.

Here is how a daily chart looks now for the S&P500:

And here is what happened in March 2008 after a similar pattern

This is not a reason to short today, especially given the Globex rally, but bulls should be careful as pullbacks can turn into much deeper sell offs.

Tuesday, August 23, 2011

Update

It seems I have been shaken out by the earthquake. Literally.

Out at 1141

Too big a sell off after the lunch

Long at 1145.25

I expected the market to trade lower than 1120 so I missed the first part of the rally. I am expecting a strong close and continuation until Friday.

Monday, August 22, 2011

Time to Go Long

I believe it is time to start looking for long entries. The market is oversold according to the total put/call ratio 5 day ema:


Also, the market will have a general upward bias heading into Friday's Jackson Hole speech.

A good level to enter is the lower end of the overnight range, around 1110. If today gaps up and keeps going, an opportunity to go long might come up tomorrow, but from higher levels.

The next development in this bear market rally is a move up to 1200 and above. The rally will continue until the cpc 5 day ema above approaches the upper horizontal line.

Thursday, August 18, 2011

Covered Short at 1133

The market seems to reject new lows near the close. There might be some more weakness tomorrow but I think a move up will start from around 1120-1130 and last until the Jackson Hole speech next week.

Wednesday, August 17, 2011

Short at 1197.75 ES

The market did not come to 1208.5 where I was planning to sell, so I have to adapt. There is a little risk of more upside on the economic data tomorrow so this is not a full position.

Tuesday, August 16, 2011

Intermediate Term Bear-Market Rally


The overbought and oversold levels for the 5 day ema of the put/call ratio (chart above) are lower for the bear market, so I adjusted them accordingly.

This indicator reached oversold and the market started to rally, so I think we are now in an intermediate term bear market rally. These go up 10-20%, last for 1-2 months and are volatile.

Shorter term, the simple put/call ratio suggests there is more upside in the coming 1-2 days.

The green arrows highlight the ratio moving contrary to the market. A deeper daily correction usually takes place after a bigger spike to the upside on the inverted chart. Thus, today's gap down is a short term buy, but a fast rally to 1220 is a sell.

The bear-market rally will resume its course after a 2-3 day deep correction on the daily chart.

Saturday, August 6, 2011

The Bear Is Back

Last post before I go. If the recent market action was not enough to convince people that the bear is back, here is some more factual evidence.

All my indicators reached bear market territory. Here is an important one: 52 week NYSE New Highs - Lows.

Notice the different behavior compared to August 2010, when the sell off in the market was even bigger. Back then, NYHL came after it had made new highs for the bull market and did not go too much below 0. Now, it is coming after big divergences versus the market and has reached well below 0.

Friday, August 5, 2011

Update

No entry today. The market did not behave as expected. Also, the put/call ratio is no longer oversold near the close, suggesting some more weakness at the beginning of next week, although probably there will be no new lows.

I will not be able to trade or post consistently next week. I will be back on next Sunday or Monday.

Oversold

With the intraday reading on the cpc ratio currently at 1.5, the 5 day ema would look something like this:

Finally oversold. This warrants some small size bottom picking, today, after the lunch. My favorite level is 1177 ES. The market is already there but it is risky to go long just ahead of lunch time.

This being said, I will look for a strong rally to close the day. I expect a 10 % rally to start from here and go on until the end of September.

Thursday, August 4, 2011

Bottom

Since traders keep hoping for a bottom, as suggested by the too bullish behavior of the put/call ratio (intraday reading),

and since I expect the sell off to continue until after the NFP number, I think the eventual bottom will come in somewhere around 1180 SPX.

I obtained this level by fitting the 61.8 level of the fibonacci matrix to the 1282.86 SPX short term bottom on July the 29th, on a 4 hour chart. This level is also the bottom of the November 2010 5% correction.

Consumption Ready to Bounce

Here is a chart of the average monthly percent change in personal expenditures on durable goods:

This series has topped at the beginning of the year and has accompanied the weakness in the stock market. Now, it is at the levels from where it usually turns back up. This will happen during the autumn and will accompany a bigger move up in the stock market. The behavior of this strengthening in the economy and the markets will be very important for the future of the bull.

Wednesday, August 3, 2011

The Bear Market - More Evidence

I inserted below a chart of the 13 day EMA of TRIN. The two big moves highlighted by red boxes are not usual in normal bull market corrections. They suggest that on big down days like yesterday traders sell with conviction.

Also, whenever the TRIN makes such a move after a multiday sell off, a bounce is near. I think this will happen on Friday, on the NFP number.

Monday, August 1, 2011

Debt Ceiling Deal Reached - Green Light to Short

The GDP number was bad but the bigger than expected slowdown is mainly due to a big negative contribution for motor vehicles and parts - consequence of the Japan earthquake - and a negative contribution from the consumption of gasoline and other energy goods. Both are temporary events, but they can influence the economy. We will see how the bounce behaves this autumn!

Meanwhile, the market can be shorted with no risk of major surprises from the political front, since the debt ceiling debate is close to being left behind. The bad expectations for the NFP number will probably drag the market down after the initial rally on the debt ceiling news. I will start looking for a short tomorrow. For now, the market is oversold over the short term and ready to bounce. In order to sell, I would like to see first a spike up on my cpc chart and the ES around the 1313 resistance.


I think the market will trade down until Friday after a short bounce and then head up again into the FOMC next week. I also expect a bigger rally this autumn on the back of improving economic data. The quality of this rally will give me info as to whether the bull has ended or not.


Wednesday, July 27, 2011

The Future Starts To Look Grim

I am talking about the future of the economy.

I am starting to see signs of a new recession and a new bear market. For now, this is just speculation with no technical confirmation from the markets, but there are a few clues that hint in this direction.

First, here is the chart of the leading indicators for the OECD countries and for the emerging economies. The chart is taken from the ECB latest monthly report.

The red line and circles are mine. Notice that the series is starting to turn. The same turns coming from such levels in the past have been leading economic recessions.

Then, a leading indicator of economic and stock market performance has just broken its bull market range: Gallup Economic Confidence Index. This break is confirmed by the advance data for July for the UM Consumer Sentiment (chart not included).

Looking back into history, I learned to trust confidence indicators. The above is a strong signal of future trouble. I found that such a signal is to be taken seriously when the move is confirmed by the Index of Major Purchases in Europe - a consumer confidence measure that is calculated by myself using data from the monthly consumer survey in Europe.

The recent weakness of this index is as big or bigger than at past major tops.

The above does not necessarily have implications for the intermediate term for now, but it might have after a few months. I think the market will start to anticipate the expected H2 2011 economic acceleration, probably after weakness into the August NFP number next week. Still, if economic data does not come in strong enough this autumn, the bull market will probably end.

I am labeling this post "the next bear market" because I intend to gather more data on this as it becomes available.

Tuesday, July 26, 2011

Out at 1328

We got a too big pullback and no big bounce after the 10 am data. Intraday cpc is also too bullish.

Long at 1332.5

I am looking for a strong rally today

Ready for Break-Out

Above, in the weekly chart, the SPX is up against strong resistance. By the looks of it, it is ready to break out above. With the debt ceiling raise deadline approaching very fast, I think the market will rally in advance, starting today.

A bearish case can be still made. Indeed, the latest two strong up days did not generate more than 90% of the volume to the upside. Also, the 13 day ema of TRIN has dropped unusually fast on July the 11th. A strong day down from these levels would switch me to the bear camp, but I do not think this can happen until there is a clear resolution on the debt ceiling.

Monday, July 25, 2011

Out at 1328.25

I was stopped out immediately after the Sunday open.

My outlook had switched to bullish but the current market action, if it results in a big trend day down, will make me look again for a move to the 1270 zone.

Friday, July 22, 2011

Long at 1335.25

The market corrected about 11 points (double the previous corrections in this up move) and it seems to hold the 1334.5 support.

I am now looking for new highs on the daily chart. My range bound scenario is wrong.

Wednesday, July 20, 2011

Out at 1323.5 ES

The market is acting weak near the close. This is normal behavior after a strong day like yesterday but I do not want to risk it, especially since my initial target of 1330 SPX was reached

Holding Longs

The market is already at my expected target but the EU summit is tomorrow. Also, with signs of agreement over the debt ceiling coming from the US, I do not think traders are going to risk it on the short side today. We might even get a nice surprise from the housing data at 10 am. Thus, I will keep my longs unless there is significant weakness today. The next target to the upside is SPX 1340.


Tuesday, July 19, 2011

Long at 1311.25 ES

Smaller than usual position size because the market is already up a lot.

Short Term Roadmap

My very short term outlook (several days) has changed. I now expect a multiday direct rise until the EU summit on Thursday. Then, I expect a further drop just below the 200 DMA.

The main reason for this move up is the way the market tries to anticipate the outcome of the EU summit. This scenario is confirmed by yesterday's strength after the lunch.

I expect this rally to stop around the SPX 1330 daily resistance and be followed by a further drop to the 200 DMA because I think the market will fall into the Q2 GDP report on the 29th and also, because I noticed that this is a good general roadmap for bigger corrections. Here is the January 2010 correction:

A match between what is expected to happen now and what generally happens suggests the scenario has some good odds of success.

Monday, July 18, 2011

Out at 1299.5

I do not like the persistent strength after the lunch and I did not have the best entry.

Short at 1303.5 ES

Looking for a big trend day down.

Weekly Wrap Up, July 11 - July 15 2011

Economy: Retail Sales report suggesting future consumer strength

The pace of change of real retail sales has started to slightly accelerate from between the green horizontal lines, a turn that usually suggests the series will rise in the near future.


S&P500: The market looks prone to play the range-bound theme

As the weekly SPX chart above shows, the initial powerful thrust upwards (green ellipse) has not had follow through (red ellipse). Since breadth has been weak lately and since it stayed weak, as the TRIN 13 day ema suggests, the market will most probably retrace towards the bottom of the range shown above.


Looking Forward

Next week will be marked by an ongoing earnings season, ongoing negotiations over the debt ceiling, by housing data and by a big EU summit on Greece. I think the market will anticipate/react to most of these events by falling. Only the EU summit may induce some upside for the market as it will probably try to anticipate a positive outcome.


Trading

I will be looking for short-term short entries on Monday or Tuesday. Although there were some good pull backs last week, I deferred shorting as I expected the incoming economic data and Ben Bernanke's testimony to represent reasons for a multiday pull-back.

As the market fell this last week, it seems that smaller pull-backs were 10 points long and a larger pull-back was 20 points long. At Friday's close, the market had already retraced 10 points from the intraday low on Thursday.


Wednesday, July 13, 2011

Range-Bound

The market action after the bad employment report on Friday is not something that fits in my new bull leg scenario. Also, one indicator I watch for breadth, the 13 day EMA of TRIN, dropped unusually fast on Monday's sell off (the scale is inverted), a behavior uncommon to bull legs.

Adding yesterday's very weak close made me change my short term outlook. I am expecting a drop in the next weeks to the SPX 1260-80 zone, before any significant upside. This way the market may continue to play the range-bound theme and look similar to the range in 1991, after the big 30% + rally that started in 1990.

This market weakness fits the anticipation of a weak Q2 GDP report at the end of the month, as well as probably a not too good earnings season.

Monday, July 11, 2011

Stopped Out at 1331

I had left a stop loss overnight.

I will look to reenter starting tomorrow. I hope this pull-back does not get too big to allow everyone to try the long side.

Sunday, July 10, 2011

Weekly Wrap Up, July 5 - July 8 2011

Economy: Bad employment number

Despite the bad NFP number for June, the average pace of change in private payrolls is showing just some normal volatility as it did in previous expansion cycles.

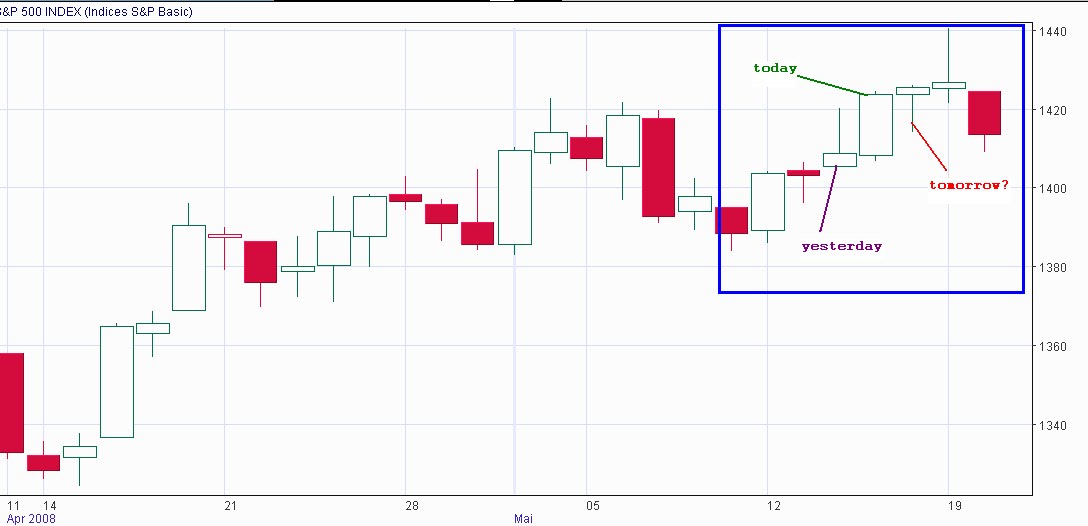
S&P500: The market is ready to power higher

Previous up legs closed higher almost every week after the inital rally off the lows.

Shorter term, the 1341 SPX support on the daily chart was not broken while the market registered a normal 20 points correction:


One Week, One Stock: Intercontinental Exchange (ICE) - looking good

Yearly sales growth is expected to register a mild slowdown in FY 2012, which does not look ominous and should not bring earnings surprises.

Using the historical P/E range and an estimate for the EPS at the end of FY12, I got an average price target of 166.


I discounted the Zacks.com EPS estimate by 10% in order to be conservative. At 128, Friday's close, the stock looks undervalued. Also favoring the upside is the recent trend of estimated EPS revisions:

source: Zacks.com

Looking Forward

Next week we get a Ben Bernanke testimony, a retail sales report and a CPI report among other data. I think the market will anticipate these events by moving up.

In light of the recent employment report, I think the market will rise into BB's speech. Also, there are strong expectations from the retail sales report and I expect the CPI to come in showing a further slowdown in its average pace of change.


Ideas

(continued from last week's wrap up, ideas section)

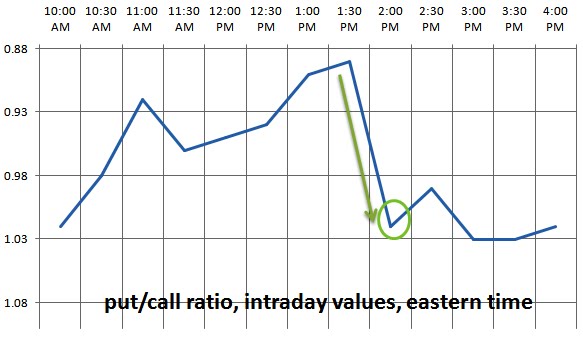
The intraday movements of the put/call ratio would have suggested long entries starting at 2:00 PM, eastern time. Not bad!


Trading

I am long from 1330.5 ES (entry posted here).

I will be looking for opportunities to further add to this position as the market confirms Friday's after-the-lunch strength.