Showing posts with label gold. Show all posts
Thursday, October 17, 2013
Treasuries and Gold
The chart above shows the December weekly futures contract for the 10-year T-Note.
The T-Notes have a good track record of anticipating turns in the business cycle and, implicitly, in the stock market. The rise in September and the possible trend reversal if the highlighted level is broken, are similar to the behavior at the 2007 and 2011 peaks, confirming the scenario of at least a slowdown in the economy.
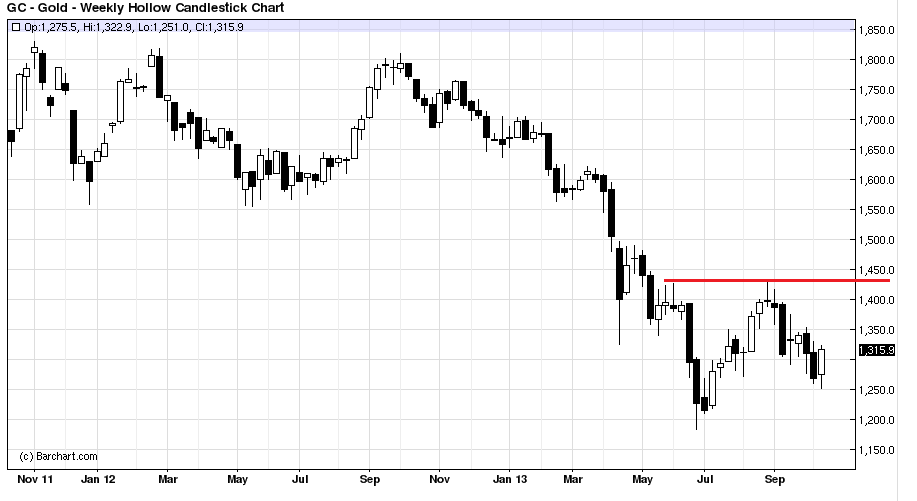
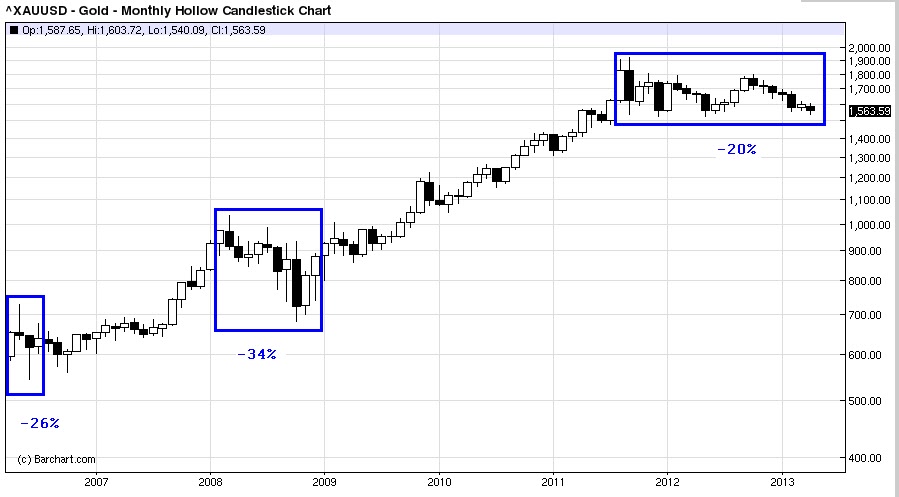
If we interpreted Gold as a fixed income asset (here is why), then it has a lot of upside potential. Gold also started rising in the past just before major economic slowdowns.
Here is a weekly chart of the December contract for Gold.
Saturday, April 6, 2013
April 6, 2013 - slowdown confirmed, gold to bounce
The employment data that came on Friday generally confirms the slowdown I talked about in my previous post.
Here is a chart of a short term rate of change in employment. The series has further to fall.
From another point of view, this slowdown in employment may very well have marked the top for this recovery. Here is a yearly percent change in private payrolls (excluding health & education payrolls which are not cyclical).
The top is already in place from last year. In previous cases the series continued its fall.
During the previous bull it had topped in April 2006 and the market followed only more than a year after. This is why this bull market, even if quite old, has further to go.
Meanwhile, the price of gold has reached the bottom of a long trading range.
As I wrote in my previous post about gold, its price is rising in anticipation of economic weakness, and falls when the economy accelerates. I have anticipated the economic slowdown, but gold continued to fall. This may suggest further weakness this year.
But until then, gold is at important support and is a short term buy as it bounces during the correction in the stock market. Then, the time will come for another leg down as the correction on the monthly chart could be bigger than 20%.
Friday, December 21, 2012
December 21, 2012 - buy gold
What drives the price of gold? Inflation and inflation expectations would respond most people interested. In fact, some are obsessed by more than inflation - hyperinflation is just around the corner and it is going to make the price of gold shoot through the roof! They cannot explain why gold has risen despite the rather deflationary environment since 2008, but they have made money and that's all that matters.
But there is another view, which is not known to many. Gold is priced just like bonds are. That means that gold is sensitive to the expected fluctuations of the real interest rate. Here are some blog post by Paul Krugman explaining this:
http://krugman.blogs.nytimes.com/2011/09/06/treasuries-tips-and-gold-wonkish/?smid=pl-share
http://krugman.blogs.nytimes.com/2011/09/10/golden-spikes/?smid=pl-share
http://krugman.blogs.nytimes.com/2012/08/26/golden-instability/?smid=pl-share
In short, what this means for gold now is that it should rise whenever the economy is expected to slowdown, because this would imply a lower real interest rate as long as the Fed keeps inflation expectations relatively high.
As I said in my previous post, a slowdown in the economy, and mostly in employment, can be anticipated starting in January. If retail sales continue lower, the direction will be confirmed. Meanwhile, Gold has come to a very nice, low-risk buy point - committing below its 200 DMA and hitting monthly support.
I think this point will represent the low for the multi-month correction in gold and that a move to new highs will start soon. Generally, gold is ending its corrections as the market approaches a bigger correction. With yesterday's developments regarding the fiscal negotiations, a more important top for the stock market may have been pulled closer.
Subscribe to:
Posts (Atom)