Friday, December 31, 2010

Another Sell Signal

This is for the intermediate term and it usually leads the actual top:

The above is a title from the home page of Le Monde, the main non business journal in France. They almost never focus on the stock market outside the economic section.

Another Sell Signal

Thursday, December 30, 2010

Outlook for Early January

Here is another very insightful resource from Gallup: short term Economic Confidence Index.

source: Gallup Economic Indexes (clicking the link will take you to the original chart for the index and some explanations from Gallup)

The index has recently reached the horizontal red line. In the past this has been followed by a correction in the stock market. The index also times the important bottoms pretty well.

The put/call ratio also suggests we are about to witness at least a short term top today or tomorrow:

When the ratio barely moves and diverges from the market a top is very close.

Meanwhile, weakness in breadth has become more evident:


Since NYHL is a widely followed indicator, I think many traders are expecting a bigger correction to start soon. This makes me think that, after an initial sell off into next week's employment report, the market will rally again to new highs before any intermediate term correction begins. NYHL will probably spike higher on this rally confusing everybody (it often does that).

So here is, in short, the tactical plan ( as usual this is subject to change as the picture becomes clearer). I will choose some of the three actions in italics:

1. sell/take profits/watch rallies until Monday (one especially good shorting opportunity will emerge after the ISM number on Monday); 1262 SPX looks like a good level but the spike in volatility on Monday could offer a higher level to the patient ones;
2. cover/go long/continue watching next Thursday or Friday after about 20 points of downside (around the 20 DMA);
3. expect new highs around the 1270 SPX level.

Wednesday, December 29, 2010

Evidence of Consumer Strength

The chart below is an average of daily self reported spending by US consumers:

source: Gallup.com

Notice how the series stayed below the 80 level for the whole period since the recovery began.

The good news is that it has recently broken above that level, an event that suggests increasing consumer strength and confidence. Since the series is volatile it could easily drop below 80 again. A confirmation of strength would be reaching 85 or above a few more times in the future.

Thursday, December 23, 2010

Merry Christmas to All

I may not post with the same frequency during next week.

For the period until the end of the year I am expecting a small correction followed by more strength. I will update if something significant comes up.

Meanwhile, I will let you ponder over this chart:

Will this bull leg end with a divergence in the New Highs - New Lows indicator, or, on the contrary, with it displaying strength as it did before the other two intermediate term corrections in January and April 2010?

Wednesday, December 22, 2010

Short Term Top For Today

I think the market has arrived at a short term top. The put/call ratio has climbed slowly back towards overbought levels, after being there last week. This pattern usually precedes tops:

I think the market will start to go down from the ES 1252-1254 zone. A 15 point correction seems to be the norm, but, given the low volatility, it might end after only 10 points to the downside.

The bullish sentiment is increasingly visible in the media. Today I even saw a projection of 1500 for the SPX until June 2011! This leads me to believe that, after a small correction, the market will make new highs and then start an intermediate term correction in January. The only caveat to this scenario is that something similar also happened in January 2010.

Tuesday, December 21, 2010

Just Another Bullish Outlook

Outlook for 2011: the economy will continue to expand, the stock market will reach 1400 SPX.

In short, I think 2011 will be a year marked by improvements in employment and a stabilization/improvement in the lagging housing and small business sectors. The stock market will benefit from these growth synergies and the available liquidity.

Here is in more detail how I expect things to unfold:

> in the first quarter the pace of change in real retail sales will slow down:

> this will accompany an intermediate term correction in the stock market:

My best guess is that this IT correction will begin around 1270 SPX. A 10% fall will take the market to 1140, close to the support level obtained using the fibonacci retracement.

> Then, as the retail sales series starts climbing again, the employment situation will improve and the stock market will rally:

The pace of change in private payrolls will probably reach the higher levels usually attained during previous expansions.

The SPX will start a new average bull run of about 20%.

> During the year the small business sector will start recovering after a long adjustment:

The index has recently spiked up. Notice that this index is correlated with the economic conditions. A recovery in this part of the economy will help employment improve.

> The housing sector does not get worse. A bottom is signaled by the related magazine covers during 2010 (especially Time).

What can be said for sure about outlooks one year ahead is that they will be off. However, this outlook represents a framework that is indispensable in trading. The outlook is subject to change as the picture becomes clearer. It is very important to be flexible and not to get married to it.

Here are some developments that may alter my expectations:

> the stock market shows very bad breadth during the intermediate term correction, suggesting the bull is over;
> the current bull leg does not stop until close to 1320 before it corrects. This would change the target for the correction to around 1180 but would not significantly alter the 1400 target on the upside;
> the economy shows signs of weakness, with the retail sales and employment series not acting as expected. The GDP reports show the consumer is not taking over any more;
> the problems in Europe become worse.

I will monitor the related indicators and adjust accordingly.

Monday, December 20, 2010

Market Outlook

The put/call ratio has not offered any edge lately:

All I can say for sure is that there is no indication of an overbought condition yet since the short term top on Tuesday. This, combined with the seasonality, means the path of least resistance is still up.

However, I think the market will be choppy and will not roar higher. A strong indication of weakness is a small range day with greater than average volume. This is what happened on Friday:

I also marked a previous similar case.

If today opens with a relatively large gap up, I think profit takers will seize the opportunity.

Friday, December 17, 2010

Near Future Bias

I presented the chart below yesterday:

This time I also drew a bigger red circle to highlight the three times in recent history that the series reached about the same level as it did lately. Here is what the stock market did in each of the cases:

The smallest correction that followed was the one in September 2009, of about 5.5%.

In other cases in the past the story is the same. There is sometimes a longer period of maximum 2 months before a bigger correction starts, but that also depends on the context the stock market finds itself in. Since until now the SPX has risen about 20% it is not hazardous to expect an intermediate term correction soon.

However, I think the market will drift upwards to around 1270 before this bigger correction. Weakness should become apparent on the way up. In fact, some breadth indicators are already diverging from the market.

Thursday, December 16, 2010

As Good As It Gets

Sorry for the late post. Here is an updated chart of the pace of change in real retail sales:

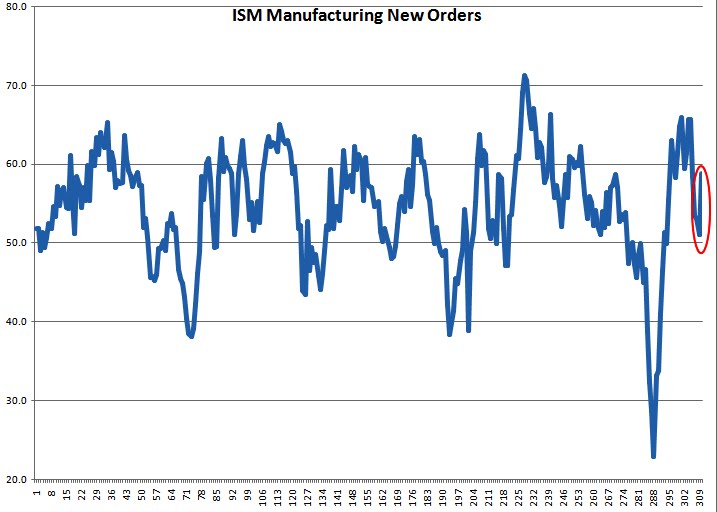
It has reached the upper boundary of its range. This suggests the economy is strong enough to continue expanding but also that a bigger correction in the stock market is not far away. I will detail with some examples from the past in a future post.

Wednesday, December 15, 2010

Market Outlook

The put/call ratio will become oversold quite fast given yesterday's behavior:

Usually, in uptrends a good strategy to buy is on weakness after trend days down. If today is such a day, I think tomorrow there will be a good opportunity to go long until the end of the year. With most of the important monthly data behind and with no negative surprises, I do not think the market will find many reasons to go down.

Tuesday, December 14, 2010

Update

Although I think the correction will start around these levels, I decided to refrain from shorting. However, if I did short, I would do it between ES 1242-1245 (March contract) with a stop at 1253.5.

Market Outlook

I have not much more different to say today than I said yesterday. The spike in the put/call ratio confirms my assumption of a correction in the next few days:

I think the market will stop after it rallies on the Fed announcement. My guess is, if the retail sales report does not bring a negative surprise, that the March contract will first reach about 1245 before selling off.

The real retail sales number will give me a clue as to when to expect the next bigger correction. I will provide a chart after the CPI release tomorrow.

Monday, December 13, 2010

Correction Coming

One of the more accurate indications of a correction coming is the turn of the 5 day ema of the total put/call ratio after it has penetrated the overbought zone:

The turn happened at Friday's close so, judging by the past behavior, a top is just 1-2 days away. I think the best opportunity to take profits or sell will emerge tomorrow after the Fed announcement.

How big a correction is anybody's guess. I expect it to reach the 20 day MA quite fast, probably in the SPX 1215 area. I also expect the simple total put/call ratio to give another signal for going long. Becoming too bearish in an uptrend in the middle of December would be a mistake.

For today's trading, I think the gap up will be sold but the market will hold after the initial small sell off and probably close strong again.

Friday, December 10, 2010

Still Overbought

The market is very resilient. After each sell off it bounces back. This is a characteristic of fast trends. It is good to remember that they bounce back until they don't (my second tribute to Yogi Berra in two days!).

The 5 day ema of the put/call ratio has made a new high for this bull leg:

Since, usually, bigger corrections come after the 5 day ema diverges from the market it follows that the next correction will not be very big. This is an important observation for the near term bias.

Thursday, December 9, 2010

"It's Deja Vu All Over Again"

The last time I titled my post "Correction Not Over" the market mocked me with a huge trend day up. It happened on the 5th of October. Will this time be the same since yesterday's post has the same title?

Back then the put/call ratio had refused to move while the market started to go down and led me to believe that there was still downside to come. The same has happened now:

Interestingly, in the previous case the ratio moved to oversold levels only as the market rallied to new highs.

If this time around is no different, than buying the big gap up would be the right thing to do. However, I will refrain from doing that since the 1250 level is very close. I also think that, even if the market closes strong today, tomorrow or Monday will offer a pull back to enter on with lower risk.

Wednesday, December 8, 2010

Correction Not Over

The weakness in the second part of yesterday's session suggests the market will go a little further down. My expectation of a 25 point correction implies a target of 1210 that looks attainable especially with the put/call ratio and the 5 day ema of the put/call ratio still close to or at overbought levels:


Here is how the market could look like at tomorrow's close:


Each candle above represents a day, with the first in each case being analogous to yesterday.

Tuesday, December 7, 2010

Covered at 1234.25

Ready to Take Profits

The 5 day EMA of the total put/call ratio is very close to the overbought level,

while the simple total put/call ratio is overbought and displaying a pattern often associated with short term tops:

The above in the context of a big gap up suggest that I should take most of my profits today. I will leave only about one third of my long position open just in case I am wrong and the market goes straight to 1250 (timing corrections in a fast uptrend is hard).

My favorite level to cover is the high of the overnight range up to now, 1234.25 ES, but anything above SPX 1230 will do. I expect a 25 point correction by the end of the week, after which I plan to reenter my longs for a move to new highs. The FOMC meeting next week will act as a magnet for the new rally.


Monday, December 6, 2010

AAPL - Trouble in Paradise?

The sentiment towards Apple is generally very bullish. Here are two covers suggesting that:

- Time Magazine:

- Le Monde Magazine: Jobs - The new Gutenberg?

I believe that sentiment at an extreme coupled with fundamental problems represents a dangerous mix. So I did a more detailed analysis of Apple.

The company looks great at the first glance. Its sales are growing healthy and profitability is high but I have stumbled upon a few signs of fatigue:

1. The year-over-year quarterly sales growth for the next two quarters is slowing (green; Yahoo Finance estimates used):


If the 3rd quarter in FY11 grows at about a 30% rate, it represents a slowdown of 50% from a year ago, which signals big problems with meeting earnings expectations by the end of FY11.

2. The latest quarterly operating margin is dropping significantly compared to the year ago figure:

> latest Q OM: 26.77%
> year-ago Q OM: 30.18%

This means the company is slashing prices to increase sales, a behavior that cannot last forever without bringing down earnings growth expectations.

3. The latest tax rate is dropping suddenly compared to previous numbers, suggesting the company might be struggling to meet the earnings forecast:


So an explosive mix might be starting to brew. The company is not overvalued yet with a P/E of about 20 so it may continue to go up along with the markets but I think that at the next intermediate-term correction in 2011 AAPL is going to be a great short.

Friday, December 3, 2010

Market Outlook

Two big trend days in a row is quite a rare occurrence. It looks like traders have great expectations from the employment report. This is why last week I said I wanted my longs before this Friday.

The put/call ratio has reached overbought, which means that the rally might take a break around these levels. A 10 point correction would not be unusual.


I am not expecting a significant correction, however, until the 5 day ema of the put/call ratio reaches the upper horizontal line:

This might happen just as SPX makes it to 1250.

Thursday, December 2, 2010

Market Outlook for Thursday

Yesterday's action looks strong by the usual breadth measures. The total put/call ratio has not spiked too much, a healthy development for the move up:

The current level, around 0.8, does not mean overbought anymore like it did in September. The fact that the overbought level is moving higher is another indication that we are in a bull market.

Usually, after big trend days the market oscillates in the next session and confines itself to a much smaller daily range. I think this will be the case today also and this is why I expect the probable initial gap up to fail. A sell off to the overnight lows would not be a surprise. The bulls may also be prudent since tomorrow is an employment report day.

Wednesday, December 1, 2010

Market Outlook

The market is up a lot as I am writing this. Someone (I do not know who) once said the market resembles someone with manic-depressive disorder. It seems today it put on the manic face.

I explained previously why I was bullish from these levels. Here is a target for what I think will prove to be a rally in the coming weeks:

The target is obtained using the Fibonacci retracement levels. Notice how 1182 is support and 1256 the next target in case of a new high.

The first phase of my trade was establishing a core position at the base of the expected rally. If today's strength holds, the trade will enter the next phase: making small adds to my position on the way up.

These adds will be small enough not to ruin my whole trade in case something goes wrong but also big enough to matter for the bottom line. The total put/call ratio will be very useful in my adding process since it usually accurately indicates when a rally off the bottom is going to just continue higher or pause.

Tuesday, November 30, 2010

Update

My stop loss is at 1170. If that price is hit I will be out even if I do not post in real time.

Recovery to Continue, Says Europe

The chart below shows the European Consumer Confidence Index (blue) and the European Index of Major Purchases (red), an index that I constructed myself using data related to major purchases in the European Sentiment Index report.

I previously analyzed the European Consumer Confidence Index (ECC) here, and concluded that a turn to the downside in the index is usually a signal of a top in the stock market and a slowing economy. I also said the the event which would invalidate this scenario was the index making a new high, in which case, according to previous similar contexts, the economic recovery would continue..

That is exactly what happened in November, with a reading above the previous high in August (green circle). Reinforcing the indication of a continuing recovery is the European Index of Major Purchases which has been strong recently (black circle).

Monday, November 29, 2010

Long Again at 1182.75

The market made me get out earlier in the day. Now it is finally rallying. Typical behavior.

Out @ 1174.75

Sold my entire position. The rally looks weak. I will reassess and try again, most probably tomorrow.

Long @ 1178 ES

Trade Plan

Today the market looks great for a long entry. No, I am not watching the charts upside down. I know the futures are down significantly. Here is why I like the way the market is positioned:

- It has sold off already. If it really turns today it probably is close to the lows.

- If it continues lower, it does not have to go too far to convince me to take my losses. This allows me to enter using a larger position than usual.

- Most of the bulls are probably shaken out or sitting on the sidelines.

For entry levels, I will adapt depending on the open but here are some areas of interest:

> around 1183 - the electronic lows from late last week;

> around 1180 - the overnight lows (until now);

> around 1175 - previous important lows.

I will enter as soon as the market falls into one of these areas.

As for stops, I will take my losses if 1174 is breached decisively but will also do some scale outs above this level if the market looks reluctant to rally.

Friday, November 26, 2010

Analogy

Today marks exactly one year since the sovereign debt trouble in Dubai has come to the attention of the media. The markets seem to celebrate the same way as they did then.

Here is how the SPX looked by the end of Monday after the Thanksgiving back then:

I also remember the put/call ratio being overextended into oversold territory as it will probably be at the close today.

This analogy reinforces my view that Monday will be a good time to buy for a move up until the end of the year.

Wednesday, November 24, 2010

Update

I bought some longs at 1193.5 but I am refraining from entering the bulk of my position this high since there is a holiday ahead of us and the markets are closed.

I expect to get a better chance to add to my longs on Monday. Here is how I think the following two trading days will roughly unfold, with the big green candle representing today:

The intraday reading of the put/call ratio (courtesy of StockCharts.com) points to increased bearishness even after today's rally:


Ready to Go Long

The market is oversold judging by the put/call ratio:

It has also showed strength yesterday by not making new lows after the lunch.

Since I think the economy will continue expanding and we are still in a bull market, it is time to buy for a move to new highs. I would have preferred to get this buy signal next week but, since it came, I have to act on it. I expect next week to offer another opportunity to buy and I will probably add to my longs then. My target is 1250.

As for levels to buy at, I like the low of the overnight range until now, approximately 1175 ES. However, I do not know if the market will go there and I am ready to start going long after pull-backs of about 5 points (it is a round number). I intend to build a large long position in the 1170-1190 area until the employment report is released next Friday.

Tuesday, November 23, 2010

Market Outlook

Today the market will try to sell off again. I think it is the last chance this week since tomorrow and Friday will probably trade with an upside bias due to Thanksgiving Day.

Meanwhile, the put/call ratio has not spiked enough to warrant a long entry:


I expect it to give a buy signal by the end of next week, around Friday's employment report. I would especially like a signal to buy before the report since I think it will come in strong.

Monday, November 22, 2010

Market Outlook

The market is ready to fall again at least to the recent lows at 1170. Here is the put/call ratio indicating an overbought condition:

The ratio reaching above previous overbought levels indicates that many traders have become too bullish with the recent good economic data and the prospects of an end-of-the-year rally. I expect them to be shaken out during the week ahead.

Sunday, November 21, 2010

Industrial Production at "Support"

Here is a chart of a series describing the average pace of change in US Industrial Production:

I have drawn some important levels, from which the series has turned in the past. Currently it is at the blue horizontal line after a slowdown which is not uncommon during economic expansions. I expect the series to turn back up and rise toward the upper black line.

This expectation is reinforced by the lagged correlation that exists between Industrial Production and the New Orders component of the ISM Manufacturing index. Notice how the New Orders index has sharply turned up also from what looks like a support level around 50:


Friday, November 19, 2010

Weak Rally

Yesterday looked very strong around lunch time: huge gap up with follow through. This market action on top of retail sales good news made me start buying just in case I missed the bottom.

Usually, on big trend days there is a pause during lunch and then a continuation but only after a shake out. The shake out happened after 2pm around the 1196 level and I went long. However, the market failed to make new highs although it tried. I interpret this as a major indication of weakness.

After the close I noticed two other signs of weakness:

- yesterday was not a 90% volume up day (it was just 88%);

- the consumer discretionary sector etf (XLY) underperformed the more defensive consumer staples etf (XLP):

Each of these weaknesses taken separately don't mean much but when taken together suggest this rally will fail.

I will wait for the market to become oversold again before another attempt at going long.

Thursday, November 18, 2010

Out @ 1194.25

Long @ 1196

stop @ 1193.5

Retail Sales Strength Continues

Quick post.

The economy will continue expanding. The recession is postponed. Here is the updated real retail sales series I analyzed previously:

Since the series has reached above 0.5, I think the pace of change in retail sales is healthy enough for the expansion to continue.

Wednesday, November 17, 2010

Market Outlook


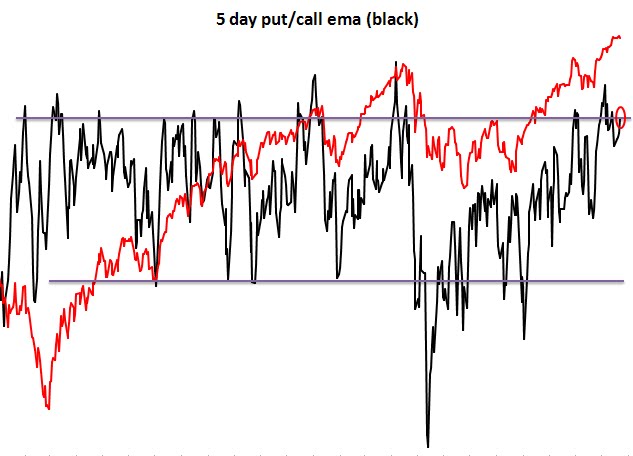
With all the downside yesterday, the put/call ratio is still outside of the oversold area. This makes me think we will see lower lows before a significant rally.

Using the Fibonacci retracements I came up with a target of 1167 on the SPX:

It is quite ironic that the twin rallies in 2010 be derailed by the same Euro crisis. For now, my outlook is still based on an end of the year rally to new highs starting somewhere end-November or early-December, but I am well aware that the Euro crisis can be the catalyst for something worse.