Wednesday, August 31, 2011
Short at 1225.75
This is not a trend day so the market is not breaking higher. I am looking for weakness in the second part of the session to hold this position.
The Poem for a Shake-out
Followed fast and followed faster till his songs one burden bore -
Till the dirges of his hope that melancholy burden bore
Fragment from The Raven by E.A. Poe
------------------
Still, I am not saying "nevermore" and am ready to short again after a probable lunch rally, if everything looks right.
Added to Short at 1219.75
This is my last add. If the market stays strong above 1220 today, my trade idea is invalidated. Until then, the market is very generous with this extended rally.
Tuesday, August 30, 2011
Short at 1205
might be a little too low but the market turned from near 1210. I will add if it goes to 1210.
Ready to Short
I am looking for a short after the FOMC minutes at 2:00. The market is already stretched to the upside and the ISM data on Thursday will most probably be anticipated by the market by dropping, given the ugly regional surveys already available from Richmond, Philadelphia and New York (Chicago is reported tomorrow).
1213 ES is my favorite level, but I would take anything around 1210.
Monday, August 29, 2011
Choppy
Bear-market rallies are usually choppy. The market can do anything.
Here is how a daily chart looks now for the S&P500:

And here is what happened in March 2008 after a similar pattern

This is not a reason to short today, especially given the Globex rally, but bulls should be careful as pullbacks can turn into much deeper sell offs.
Tuesday, August 23, 2011
Long at 1145.25
I expected the market to trade lower than 1120 so I missed the first part of the rally. I am expecting a strong close and continuation until Friday.
Monday, August 22, 2011
Time to Go Long
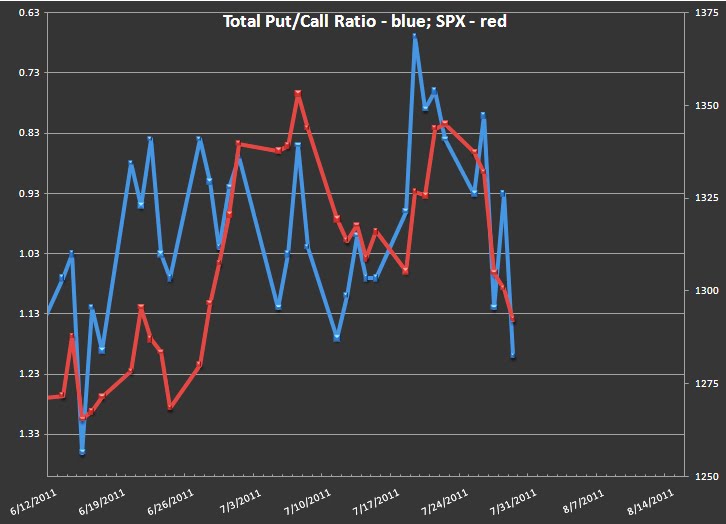
I believe it is time to start looking for long entries. The market is oversold according to the total put/call ratio 5 day ema:

Also, the market will have a general upward bias heading into Friday's Jackson Hole speech.
A good level to enter is the lower end of the overnight range, around 1110. If today gaps up and keeps going, an opportunity to go long might come up tomorrow, but from higher levels.
The next development in this bear market rally is a move up to 1200 and above. The rally will continue until the cpc 5 day ema above approaches the upper horizontal line.
Thursday, August 18, 2011
Covered Short at 1133
The market seems to reject new lows near the close. There might be some more weakness tomorrow but I think a move up will start from around 1120-1130 and last until the Jackson Hole speech next week.
Wednesday, August 17, 2011
Short at 1197.75 ES
The market did not come to 1208.5 where I was planning to sell, so I have to adapt. There is a little risk of more upside on the economic data tomorrow so this is not a full position.
Tuesday, August 16, 2011
Intermediate Term Bear-Market Rally
 The overbought and oversold levels for the 5 day ema of the put/call ratio (chart above) are lower for the bear market, so I adjusted them accordingly.
This indicator reached oversold and the market started to rally, so I think we are now in an intermediate term bear market rally. These go up 10-20%, last for 1-2 months and are volatile.
Shorter term, the simple put/call ratio suggests there is more upside in the coming 1-2 days.

The green arrows highlight the ratio moving contrary to the market. A deeper daily correction usually takes place after a bigger spike to the upside on the inverted chart. Thus, today's gap down is a short term buy, but a fast rally to 1220 is a sell.
The bear-market rally will resume its course after a 2-3 day deep correction on the daily chart.
Saturday, August 6, 2011
The Bear Is Back
Last post before I go. If the recent market action was not enough to convince people that the bear is back, here is some more factual evidence.
All my indicators reached bear market territory. Here is an important one: 52 week NYSE New Highs - Lows.

Notice the different behavior compared to August 2010, when the sell off in the market was even bigger. Back then, NYHL came after it had made new highs for the bull market and did not go too much below 0. Now, it is coming after big divergences versus the market and has reached well below 0.
Friday, August 5, 2011
Update
No entry today. The market did not behave as expected. Also, the put/call ratio is no longer oversold near the close, suggesting some more weakness at the beginning of next week, although probably there will be no new lows.
I will not be able to trade or post consistently next week. I will be back on next Sunday or Monday.
Oversold
With the intraday reading on the cpc ratio currently at 1.5, the 5 day ema would look something like this:

Finally oversold. This warrants some small size bottom picking, today, after the lunch. My favorite level is 1177 ES. The market is already there but it is risky to go long just ahead of lunch time.
This being said, I will look for a strong rally to close the day. I expect a 10 % rally to start from here and go on until the end of September.
Thursday, August 4, 2011
Bottom
Since traders keep hoping for a bottom, as suggested by the too bullish behavior of the put/call ratio (intraday reading),

and since I expect the sell off to continue until after the NFP number, I think the eventual bottom will come in somewhere around 1180 SPX.

I obtained this level by fitting the 61.8 level of the fibonacci matrix to the 1282.86 SPX short term bottom on July the 29th, on a 4 hour chart. This level is also the bottom of the November 2010 5% correction.
Consumption Ready to Bounce
Here is a chart of the average monthly percent change in personal expenditures on durable goods:

This series has topped at the beginning of the year and has accompanied the weakness in the stock market. Now, it is at the levels from where it usually turns back up. This will happen during the autumn and will accompany a bigger move up in the stock market. The behavior of this strengthening in the economy and the markets will be very important for the future of the bull.
Wednesday, August 3, 2011
The Bear Market - More Evidence
I inserted below a chart of the 13 day EMA of TRIN. The two big moves highlighted by red boxes are not usual in normal bull market corrections. They suggest that on big down days like yesterday traders sell with conviction.
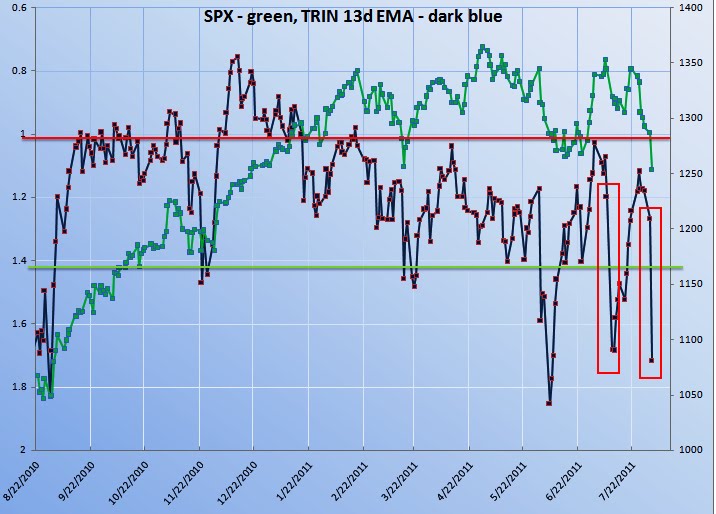
Also, whenever the TRIN makes such a move after a multiday sell off, a bounce is near. I think this will happen on Friday, on the NFP number.
Monday, August 1, 2011
Debt Ceiling Deal Reached - Green Light to Short
The GDP number was bad but the bigger than expected slowdown is mainly due to a big negative contribution for motor vehicles and parts - consequence of the Japan earthquake - and a negative contribution from the consumption of gasoline and other energy goods. Both are temporary events, but they can influence the economy. We will see how the bounce behaves this autumn!
Meanwhile, the market can be shorted with no risk of major surprises from the political front, since the debt ceiling debate is close to being left behind. The bad expectations for the NFP number will probably drag the market down after the initial rally on the debt ceiling news. I will start looking for a short tomorrow. For now, the market is oversold over the short term and ready to bounce. In order to sell, I would like to see first a spike up on my cpc chart and the ES around the 1313 resistance.
I think the market will trade down until Friday after a short bounce and then head up again into the FOMC next week. I also expect a bigger rally this autumn on the back of improving economic data. The quality of this rally will give me info as to whether the bull has ended or not.
Subscribe to:
Posts (Atom)