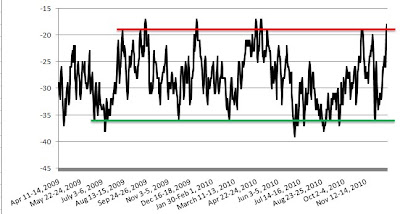
Here is another very insightful resource from Gallup: short term Economic Confidence Index.
source: Gallup Economic Indexes (clicking the link will take you to the original chart for the index and some explanations from Gallup)
The index has recently reached the horizontal red line. In the past this has been followed by a correction in the stock market. The index also times the important bottoms pretty well.
The put/call ratio also suggests we are about to witness at least a short term top today or tomorrow:
When the ratio barely moves and diverges from the market a top is very close.
Meanwhile, weakness in breadth has become more evident:
Since NYHL is a widely followed indicator, I think many traders are expecting a bigger correction to start soon. This makes me think that, after an initial sell off into next week's employment report, the market will rally again to new highs before any intermediate term correction begins. NYHL will probably spike higher on this rally confusing everybody (it often does that).
So here is, in short, the tactical plan ( as usual this is subject to change as the picture becomes clearer). I will choose some of the three actions in italics:
1. sell/take profits/watch rallies until Monday (one especially good shorting opportunity will emerge after the ISM number on Monday); 1262 SPX looks like a good level but the spike in volatility on Monday could offer a higher level to the patient ones;
2. cover/go long/continue watching next Thursday or Friday after about 20 points of downside (around the 20 DMA);
3. expect new highs around the 1270 SPX level.


No comments:
Post a Comment