On this S&P chart starting in 1988 I highlighted each bull leg. I considered to be a bull leg any rally that started/ended after/before a 7% or bigger correction.
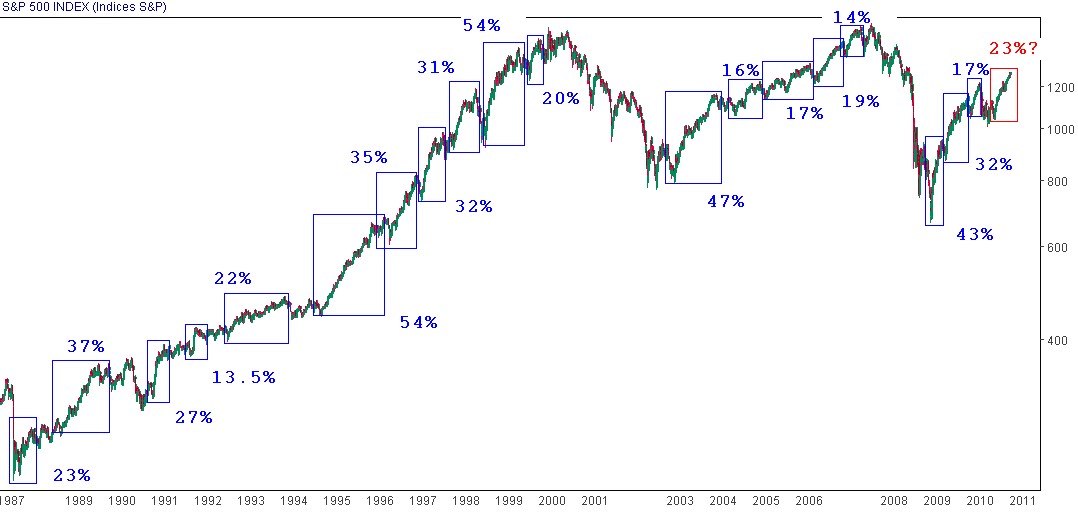
Will the last one (boxed in red) be longer than 23%?
Given that the only bull legs longer than 30% were either at the base of a bull market or during the '90s, I will assume this one will stop in its 20s.
No comments:
Post a Comment