Thursday, September 30, 2010
Update
The ES has started to rally on the GDP revision. Here is my new plan: if the market opens above 1145-46 I will wait for 1150 to add to shorts betting on an immediate sell-off. If this doesn't happen I will take my losses.
Ready to Break
The put/call ratio suggests the market is ready to break to the downside:

Notice the last spike up in the ratio (blue) after a not so bullish day.
For the last three days the SPX stayed in a range. The more it stays in a range the nastier the correction. Today it will have plenty of reasons to break-out: GDP revision, Ben Bernanke, unemployment claims, Chicago PMI.
Also, the rally in the Euro is probably over for a while. Here is EURUSD reaching the last target projected using the Fibonacci retracements on this hourly chart:

I managed to add some more shorts yesterday after the lunch. I have an average of 1142. As for stops, I would not like to see the market trade over 1145 - 46 again. If it does, I will start scaling out of my position.
Wednesday, September 29, 2010
Market Outlook
Here is how I envision the next month for the SPX:

The red line highlights what I think will prove to be a bear-market rally. The blue lines describe the future path for this rally.
The fibonacci levels provide possible targets and support/resistance levels on the way up. This is not the common way of using the fibonacci levels but it is very helpful. Notice that the next target on the upside is 1170.
Tuesday, September 28, 2010
DAX Distribution
Notice the two weeks of roller coaster moves (red horizontal segment) on this hourly chart of the DAX index:
 This coming after an uptrend usually portends a nasty correction. The last time it changed direction at the end of August it has done so after building a much smaller base (green segment).
Update
I have postponed adding to shorts for tomorrow. I do not like it when the market goes against me after the lunch. It often means there will be some continuation at the next day's open.
I am usually picky with my entries. I miss some opportunities because of this but most of the time it keeps me out of trouble; and this business is very much about staying out of trouble.
Still Looking to Sell
The similarities between now and the beginning of August continued with yesterday's action:

Like now, the market was then pausing after a move up and was ripe for a correction.
Following the analogy, today we could see strength. I do not expect the market to behave exactly the same way but, if it shows strength, I will try to take advantage of a more significant rally after the open - possibly at 10 am when the consumer confidence number is released- to add to my short position, since yesterday I only entered less than half the desired size.
I still expect a move down close to 1100 before any significant upside.
Monday, September 27, 2010
Update
Given how the market has traded for the first 30 minutes I do not think there will be a violent rally to sell. This is why I will scale into shorts gradually (leaving some for tomorrow) and will not be posting a clear entry price. The market may float under Friday's high today.
Time to Sell
Here is the updated chart of the ratio of monthly cumulative advancing versus declining volume:
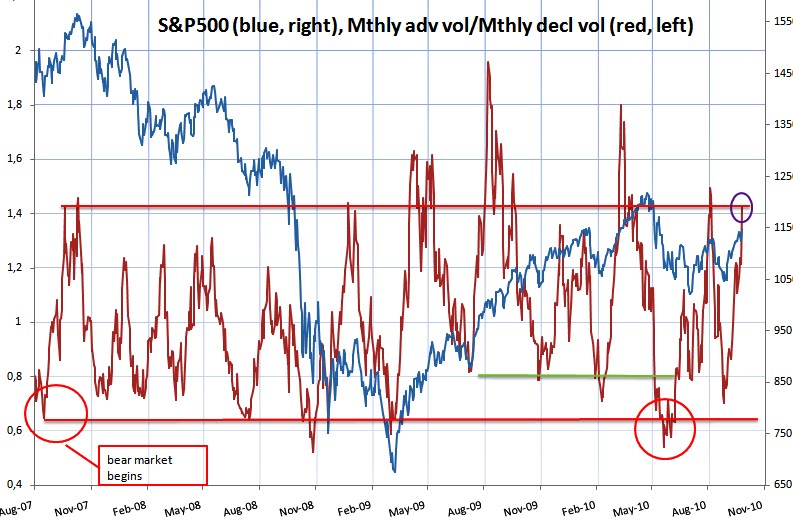
Notice the series (red) has reached the horizontal red line, indicating an overbought condition (purple circle). This is the main reason I expect a correction to start from these levels.
My main short term timing tool (read "put/call ratio") is nicely set up for a short today:

The red arrows highlight a common behavior at tops. The last "bullish spike" (second arrow) is a kind of a "kiss of death".
Consequently, I will go short after the open today on an initial rally. I am looking for about 40 points on the downside. I will start playing defense if the market continues to show strength after the lunch.
The first chart has also implications for the intermediate term. Notice how last down move reached bear market levels. The subsequent rise until today reached the overbought level for bear market rallies (red horizontal line) but I expect it to pull back from here and then retest the line once again while the market moves higher than 1150. This series going significantly above the red horizontal line would cast serious doubt on my bear market scenario.
Sunday, September 26, 2010
Update on the Context
Context is very important in trading. The value of the same setup ranges from useless to pure gold depending on the context. So here is a short update on the context I am currently trading in:
- The stock market has seen the first leg of a bear market from the 1220 top in April to the 1011 low in June (SPX values). Here is why.
- An intermediate-term bear market rally started in July and hasn't ended yet. Here is why I expected this rally to continue this autumn.
- The economy is ready for another "leg down". Here is some perspective.
Given all this, I do not have bullish long term exposure to the stock market and I am ready to take bearish long term exposure as soon as the bear market rally becomes overbought - I think we are about one month away from that event.
I am also on the look-out for evidence that would negate my views. Such evidence could be more economic strength than expected (like this series reaching the blue line), or healthier market breadth (this series breaking above the upper red line - the chart is not updated. I will update it tomorrow as it has significance for next week's trading).
Friday, September 24, 2010
Update
The market has risen furiously and is now above the 1140 level on the ES. The intraday reading on the put/call ratio looks set for a short on Monday, but I would not like to see too much strength above 1140. I will evaluate over the week-end if my initial expectation of another move down still stands.
This last week of trading brings back memories of the last trading days of July. Today looks very similar to the 1st of August:

Market Outlook
The put/call ratio is suggesting the correction is not over:

Notice there was no "bearish spike" despite two consecutive days of downside. This is why I think we will see lower prices.
However, this correction will probably not be linear. I expected yesterday to finish up strong but it didn't happen. The market could do it today.
Anyway, if SPX reaches again 1140 I will look to sell for a move towards 1100. If this is indeed a bear market rally chances are we will see a big trend day down during this correction.
Thursday, September 23, 2010
Time to Take Profits
I will take advantage of weakness today to cover my shorts. Here are support/resistance levels around the current market price for the ES:

My preferred level is 1118.75 but depending on where the market opens this can change. The home sales data is due in about 30 minutes and the market will probably be volatile.
I do not think the correction is over but there has been enough downside for the longer term bulls to start buying, especially since the market is pulling back after a break-out on the daily chart.
Wednesday, September 22, 2010
Target
I noticed this H&S on the SPX, projecting the correction to 1125:

I don't use these formations in my analysis but this time a 24 point correction (12 + 12) looks reasonable.
Defense
Here are two possible paths from here on the cash S&P500 chart:

The red one is the one I put my money on. However, if the market shows some strength above the red horizontal line today (inside the purple box), I will cut my short position in half. I will cover the rest on a move to new highs. The green path becomes the most probable in this case, with the market extending to 1162 (green horizontal line) before a bigger correction.
I have also circled in blue yesterday's correction. It is 12 points long, equal to two others on the way up from 1040. If the market does not break 1135 cash today, the uptrend is still intact. This fact plus a move above the red horizontal line would make me start playing defense.
Tuesday, September 21, 2010
The Advantage of Selling on Strength
Since I sold high and have been lucky enough for the market to go my way, I can put a stop quite close to my entry point, thus minimising my losses. This is the biggest advantage of selling on strength.
No Rally, No Sell
If the market doesn't reach at least 1140.25 on the ES after the announcement, I will not sell today.
Ready to Sell After the FOMC
As I stated recently I will be a seller tonight on a rally after the 2:15 announcement.
Here is what supports the scenario of a correction:
- first of all the put/call ratio:

- the rally is 105 points long and has not paused at all on the way from 1040;
- the media has become brave enough to express some bullish views;
- the market often reverses the previous trend after a Fed day ( remember August 11th);
- VIX has been diverging from SPX;
- my intuition;
- other.
Negating it:
- breadth getting stronger on yesterday's ramp up after many days of under performing relative to the stock market - I will ignore this fact for now (no setup is perfect).
Consequently, depending on how the market is positioned after the announcement, I will sell after a rally. I am now guessing somewhere between 1143.5 and 1148.5 on the SPX. I am looking for at least 30 points on the downside. I will try to post my trade in real-time.
Monday, September 20, 2010
Nice Rally But ...
... VIX (bars) has been diverging from SPX (line) recently:

It often does so before market turns. Notice the other highlighted divergence.
This is more evidence that today's move up does not portend continuation in the near future.
However, I think the SPX will reach at least 1144 before it breaks to the down side. I will be a seller tomorrow at or above that level, after the Fed announcement.
The LeMonde Omen
Since everybody has been looking for omens lately, I have just stumbled upon one of my own:

This is a title from the economic section of the electronic edition of the French newspaper LeMonde (click to enlarge).
It seems bullishness and hope have reached far enough for the market to stage a correction this week. A steep one, since this is a bear market rally.
Sunday, September 19, 2010
Retail Sales Strength
Here is the updated chart of the 3 month average pace of change in real retail sales:

I first analyzed this series and drawn some more detailed conclusions from its behavior here.
I have marked with the green circle the recent turn in the series. This turn comes as expected from the horizontal red line and I think it will continue this autumn as it did in the autumn of 07 (purple circle). An up tick in economic activity will make the market participants cast away the omnipresent double dip theme, just what the long term bear needs in order to continue downwards.
Until then the bear-market rally will head higher.
Friday, September 17, 2010
Benign CPI
The monthly pace of the CPI is rising further:

It is coming after a period of slow-down (to the horizontal line) which was not unusual. This is why I think the Fed will not go further yet with quantitative easing. The market, however, can rise into the FOMC on Tuesday. If it does, it will be a good short after the announcement.
Thursday, September 16, 2010
The Short Term Top Is In
I think we have already seen the top for this move up. Today or tomorrow the market will break down hard.
Here is a comparison to the short term top after the July rally:
- July rally and top (note the 2 days of consolidation after the final move up):

- September rally (the same market behavior):

I have also drawn the future path according to the analogy.
There is also a similarity in the behavior of the put/call ratio (circled in red):

I believe at this moment that the correction will take the spx to the 1090 level. I will fine tune on the way down.
Wednesday, September 15, 2010
Quick Update
I will not be able to watch the markets today for most of the session. I think a short term top is in the making. A quick guess is that it will take the spx at least to the 1090 level.
By the way the dollar and the euro traded yesterday, I would say that bulls have finally stepped up to the plate. This is a short term bearish event.
Tuesday, September 14, 2010
Update
No negative surprise.
The projection seems to be confirmed ( I was probably too conservative with the uptick - I should have drawn it bigger). I will update this series as soon as I have the CPI number for August on Friday. I think the series for the real retail sales can rise further at the next report on the 15th of October. The stock market will continue to move higher until then.
Inception
 I am posting the chart above as a preface to the retail sales announcement today.
 The two series represent daily self-reported consumer spending amounts (excluding houses, cars or normal household bills). Gallup collects the data and then calculates a weekly average. The four values for July are on the blue line, the ones for August are on the red one.
Spending for July was lower during all four weeks. The retail sales may provide a negative surprise, probably not so negative as to invalidate my projection for this series:

It is on this projection that I have built my scenario of an uptick in the economy accompanied by a rally in the stock market this autumn.
Monday, September 13, 2010
Daily Framework
Here is a 30 minute chart of the September contract (click to enlarge, chart courtesy of SaxoBank):

I still use the September contract for support/resistance levels because there are old ones that are not available on the December contract. I have highlighted the main areas of interest for today: for support 1115 and for resistance 1121.75. Depending on where the market opens, an important level is also 1119.
I will use these levels to exit my longs today after a rally into one of them.
Target Met
As I am writing this the September contract is trading close to the 1120 level. I will consider that my target was reached and cover all my longs today. I think the market will spend some time around this level, maybe trade a little higher (to 1130), but trade down for this week. This bear market rally should continue after this correction.
This week is an important one on the macroeconomic front with retails sales, industrial production and CPI data coming in. Stay tuned as another part of the economic picture is revealed.
Friday, September 10, 2010
Outlook for Friday
Yesterday the market pierced through the 1103-1104.25 zone. This made me take a defensive stance and cover some longs. If this was a fake out and the market doesn't go below yesterday's low, I think 1120 is the next stop. The put/call ratio is supportive of such a move:

Thursday, September 9, 2010
Outlook for Thursday and Beyond
The put/call ratio has spiked back to more normal levels:

If today's gap up does not fail, the ratio will probably set up for a short term top for tomorrow's opening or Monday's, around the 1120 level.
Late bulls can watch the 1103-1104.25 on the ES for an opportunity to go long. I think the market can go as high as 1117 today. A strong finish for this week would have bullish implications for the weeks ahead.
Wednesday, September 8, 2010
Market Outlook
The ratio is behaving unusually - dropping big (on my inverted chart) when there was little bearish market action:
 Normally, with the ratio at these levels, the market would be a screaming buy but the upside after yesterday's lunch has vanished quickly so this behavior casts some doubt on my scenario.
I think the 1092 level is very important. The correction from 1104 has been big enough for the market to rally from here, so any decisive weakness below this level will suggest the 1120 level would not be reached this week.
Tuesday, September 7, 2010
Framework for Tuesday
The put/call ratio has been moving downward in my inverted chart while the market has rallied strongly. This suggests more upside is in the cards:

I think the 1120 level is perfectly attainable by Thursday's close (see also this previous post for more details on this projection).
However, I expect some downside today during the first part of the session and the lunch. The ES can go as low as 1090-1092. This would leave traders looking at a 13 point correction after the lunch - an opportunity they haven't had since the market started to rally last week. I expect them (myself included) to jump right at it and carry the market higher into the close.
Sunday, September 5, 2010
How Big of a Rally?
In the chart below I highlighted 3 previous continuous spx up moves on the daily time frame. They all developed after significant lows and were between 80 and 90 points in length:

This suggests that the market will rally to 1120 - 1130 before a break of a few days can take place. If this move is similar in structure the target will be achieved in 2-3 days.
Note: For the flash crash I took the low of the next day into consideration as the initial low on the day of the crash is somewhat controversial.
Friday, September 3, 2010
Outlook for Friday
The market hasn't provided a larger pull back yesterday. Since in most of the cases it does, this is an indication of strength. The put/call ratio is behaving as usual at the beginning of longer up moves - it is fell yesterday (on my inverted chart) while the market rose:

This behavior portends at least a few more days of strength before a more meaningful correction. Today we have the employment report at 8:30. I do not expect it to be great. It could cause the market to gap down or sell off early. If it does, a 10 point correction is a buy.
Thursday, September 2, 2010
Levels for Thursday
Since yesterday was a huge trend day up, today the market will most probably oscillate. The intraday traders can fade rallies and /or buy weakness. The longer term traders can add to long exposure after a correction of about 10 points. Here is a 30 minutes chart with support/ resistance levels (chart courtesy of SaxoBank):

If the market gaps up the high of the overnight range (probably 1085) will be strong resistance. From there a 10 point sell off could take the ES to around 1076, the low of the overnight range. I expect this to be strong support.
If this rally is to continue in the following days, I expect to see strength today after the lunch.
Wednesday, September 1, 2010
Quick update
I wasn't able to watch the opening today. Anyway I couldn't have done much of an add as we had no pull-backs. The rally is on. I expect it to reach at least the 1120 level.
Subscribe to:
Posts (Atom)