Here is the updated chart of the ratio of monthly cumulative advancing versus declining volume:
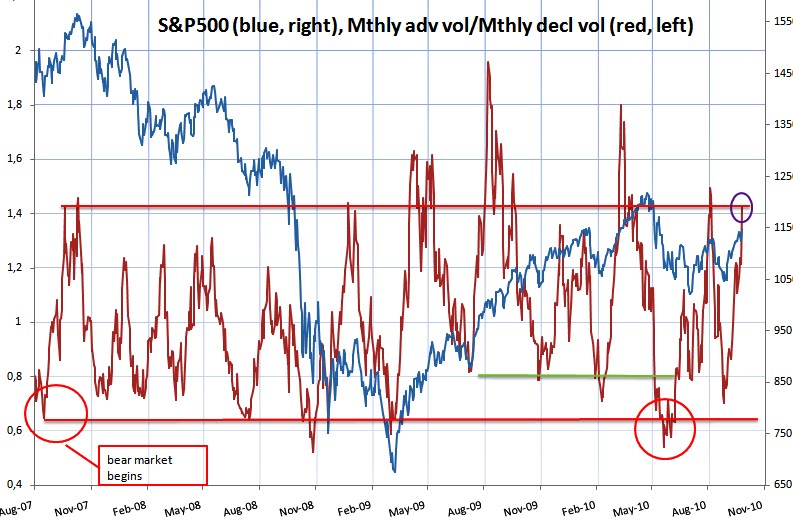
Notice the series (red) has reached the horizontal red line, indicating an overbought condition (purple circle). This is the main reason I expect a correction to start from these levels.
My main short term timing tool (read "put/call ratio") is nicely set up for a short today:

The red arrows highlight a common behavior at tops. The last "bullish spike" (second arrow) is a kind of a "kiss of death".
Consequently, I will go short after the open today on an initial rally. I am looking for about 40 points on the downside. I will start playing defense if the market continues to show strength after the lunch.
The first chart has also implications for the intermediate term. Notice how last down move reached bear market levels. The subsequent rise until today reached the overbought level for bear market rallies (red horizontal line) but I expect it to pull back from here and then retest the line once again while the market moves higher than 1150. This series going significantly above the red horizontal line would cast serious doubt on my bear market scenario.
No comments:
Post a Comment