I said previously that I had expected a bounce in the economy this autumn. It has happened (red ellipse):
I also stated that the fall would start again after this bounce (green line), following the behavior of the series in the autumn of 2007 (purple ellipse). Why fall again when this expansionary cycle is just one year old? My answer is, in short, that the adjustment in the economy is not finished. My thesis would be invalidated by the above series moving higher, say above the 0.5 level (although I do not think this will be the case, I always try to keep in mind possible evidence that would prove me wrong as soon as possible).
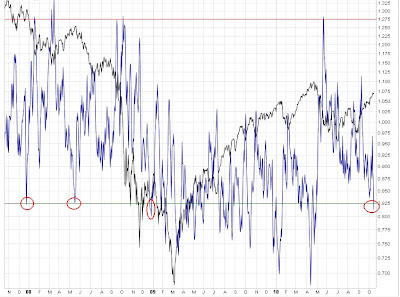
Meanwhile, the stock market has registered bear market readings as it sold off this spring-summer. As a consequence, the rise to current levels may be considered a bear market rally. The latest development on this front is one of my favorite indicators ( 5 day ema of the put/call ratio) becoming overbought:
Notice how it has reached the horizontal green line, a level where it stopped as previous bear market rallies topped (red circles). Normally this would be a clear sell, but I do not think the markets will sell off before the FOMC meeting on the 2nd & 3rd November.
I think next week we will see a correction or sideways action, followed by a extension of the rally into the Fed announcement. Depending on how things line up by then, a great long term selling opportunity will be at hand.
The above will be the framework I will work with during the next weeks. I will do a post focused only on evidence against this framework, evidence that would make me change my mind. This will be like a stop loss for a trade - an indispensable tool for any trader.


No comments:
Post a Comment