This is an average between two longer term rate of change measures. When reaching the oversold line after a correction a new bull move up usually follows.
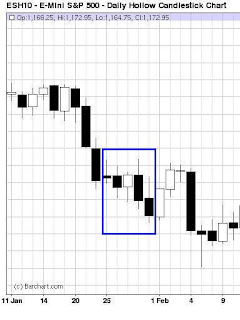
However, the indicator can dip below the oversold line before another bull leg starts. It did so during the January 2010 intermediate term correction just before a 2 day rally that only represented a bounce.
Now, the market looks the same and I think a bounce will again only be temporary.
Here is Jan-Feb 2010:
and here is May 2012:
A bounce from here would take place, as is usually the case, after a clear break of an important level. here is a monthly chart of the June contract.


1 comment:
Thanks for the update!
Tony
Post a Comment