Showing posts with label economy. Show all posts
Sunday, February 23, 2014
Falling Retail Sales and Falling Inflation
The series for Real Retail Sales shows a visible drop in the rate of growth, the kind that can be associated with a peaking business cycle, while Core CPI is resuming its downward trend, something that could suggest longer term structural weakness or just that the business cycle peak is farther away into the future.
Since the QE does not end until September given a $10bn tapering pace, the stock market seems to have enough time to complete another bull leg with 1900 - 1950 or even 2000 as possible target.
Sunday, February 9, 2014
Weakness becomes visible
The big plunge in the New Orders Index comes as a a surprise, but weakness was expected.
The NFP report confirmed the slowdown with a visible fall in the number of average weekly hours worked for January. This is a leading indicator, so if it does not bounce back soon enough, the headline NFP number should continue to be on the weaker side.
Sunday, February 2, 2014
GDP, Durable Goods and the Correction
Good Q4 GDP report with the consumption of Durable Goods still at respectable levels of growth but slowing down. In fact the annual rate of growth for December is significantly lower than the quarterly average. The behavior during the previous expansion suggests rates of growth will slowdown further.
Meanwhile, the stock market seems to have started an intermediate term correction (7-10%). The tapering is finally weighing in. Longer term support is at 1700 SPX:
Thursday, January 16, 2014
Retail Sales, CPI and the Taper
Real retail sales kept growing at a good pace in Q4, while the available data on Durable Goods (October and November) suggests a slight slowdown but still a healthy pace. No wonder y/y growth in GDP is accelerating.
Meanwhile the slowdown in Core CPI has stopped but no clear turn to the upside is visible yet.
With economic activity still strong and CPI seemingly stabilizing, the Fed can still find excuses to continue tapering.
Sunday, January 12, 2014
Monday, January 6, 2014
New Orders Index- strong but peaking
I have written already about the fact that the New Orders Index (component of the ISM PMI) is at peak levels but this time I wanted to show it another way, plotted as a quarterly 3-month average against the GDP. I am planning to show similar charts for other important economic indicators in the future.The red bar in the chart is based on an estimate for Q4 GDP.
So, it is peaking but this does not mean much for the economic expansion. Even lower levels still represent growth.
On the other hand, peaking also means strong and the stock market and the dollar will anticipate the continuation of tapering. This means a larger correction for the S&P500 soon.
Monday, December 9, 2013
To Taper or Not to Taper
I think it's time for an ACH (click for an introduction to ACH) on the much discussed tapering issue, more so, as it looks likely to be announced at the December 17-18 meeting (by tapering I also mean the communication that precedes the actual slowdown in QE).
So the hypotheses are:
H1 - the Fed will taper at the December meeting;
H2 - the Fed will not taper at the December meeting.
Here is a matrix with a score measuringmy judgement on how much each piece of evidence invalidates each hypothesis.
Evidence H1 H2
---------------------------------------------------------------------------------------------------------------------------------
E1 - the economic indicators have been strong lately
and the Fed wanted to start tapering in September + -0.75
E2 - the latest GDP report has been strong but only
due to rising inventory -0.25 +
E3 - the Fed has not started to communicate its
possible tapering intentions yet -0.75 +
E4 - a slowdown in Q4 is expected -0.25 +
E5 - Bernanke could take upon himself the responsibility
to announce the taper + -0.5
E6 - the December meeting is followed by a press
conference, a good opportunity to start tapering + -0.75
communication
E7 - the stock market has risen and the bond market
was flat after the strong NFP report, which could + -0.5
encourage the officials to start tapering sooner
E9 - inflation is still trending lower -0.5 +
E10 - the 7% unemployment threshold, which
has been mentioned by Bernanke early 2013, has + -0.5
been reached
---------------------------------------------------------------------------------------------------------------------------------
Total -1.75 -3.00
Conclusion:
H1 is less invalidated, so it wins. The mechanical conclusion of the analysis is that the Fed will start at least communicating the taper at the next meeting.
What should be seen if, indeed, the Fed were to taper? I would guess that some early signaling by Fed officials (today there are three such speeches) but also the markets could anticipate such a decision somehow - the markets were not taken by surprise in September when tapering was postponed even if everybody was ready for it to happen.
Lastly, the conclusion of this analysis is not to be taken for granted. This framework is more of a way to put arguments in order and to see the pivotal ones. Expressing conviction in probabilities is much better. In this case, I would say there is a 60% chance for the Fed to start at least communicating the tapering.
So the hypotheses are:
H1 - the Fed will taper at the December meeting;
H2 - the Fed will not taper at the December meeting.
Here is a matrix with a score measuringmy judgement on how much each piece of evidence invalidates each hypothesis.
Evidence H1 H2
---------------------------------------------------------------------------------------------------------------------------------
E1 - the economic indicators have been strong lately
and the Fed wanted to start tapering in September + -0.75
E2 - the latest GDP report has been strong but only
due to rising inventory -0.25 +
E3 - the Fed has not started to communicate its
possible tapering intentions yet -0.75 +
E4 - a slowdown in Q4 is expected -0.25 +
E5 - Bernanke could take upon himself the responsibility
to announce the taper + -0.5
E6 - the December meeting is followed by a press
conference, a good opportunity to start tapering + -0.75
communication
E7 - the stock market has risen and the bond market
was flat after the strong NFP report, which could + -0.5
encourage the officials to start tapering sooner
E9 - inflation is still trending lower -0.5 +
E10 - the 7% unemployment threshold, which
has been mentioned by Bernanke early 2013, has + -0.5
been reached
---------------------------------------------------------------------------------------------------------------------------------
Total -1.75 -3.00
Conclusion:
H1 is less invalidated, so it wins. The mechanical conclusion of the analysis is that the Fed will start at least communicating the taper at the next meeting.
What should be seen if, indeed, the Fed were to taper? I would guess that some early signaling by Fed officials (today there are three such speeches) but also the markets could anticipate such a decision somehow - the markets were not taken by surprise in September when tapering was postponed even if everybody was ready for it to happen.
Lastly, the conclusion of this analysis is not to be taken for granted. This framework is more of a way to put arguments in order and to see the pivotal ones. Expressing conviction in probabilities is much better. In this case, I would say there is a 60% chance for the Fed to start at least communicating the tapering.
Saturday, November 2, 2013
New Orders Index
"Anyone who has studied markets half-seriously learns not to associate vigorous economic activity with stock market bottoms, but with stock market tops."
Will Rahal.
Here is an up to date chart of the New Orders Index.
In the vein of the opening quote, it is hard to be bullish over the intermediate term given this chart. I do not think we can talk of a bull market top yet but a larger correction is not out of the question soon. Meanwhile, the short term looks good, with 1800 as next stop.
Here is an up to date chart of the New Orders Index.
In the vein of the opening quote, it is hard to be bullish over the intermediate term given this chart. I do not think we can talk of a bull market top yet but a larger correction is not out of the question soon. Meanwhile, the short term looks good, with 1800 as next stop.
Friday, October 25, 2013
Employment
The average rate of growth in private payrolls has slowed down steadily during the last months to a level that may mark an inflection point. Any lower than this and the economic expansion is in peril, similar to 2007. We could see a bounce from here, the most likely scenario, but it could tip the Fed towards tapering early next year.
Thursday, October 17, 2013
Treasuries and Gold
The chart above shows the December weekly futures contract for the 10-year T-Note.
The T-Notes have a good track record of anticipating turns in the business cycle and, implicitly, in the stock market. The rise in September and the possible trend reversal if the highlighted level is broken, are similar to the behavior at the 2007 and 2011 peaks, confirming the scenario of at least a slowdown in the economy.
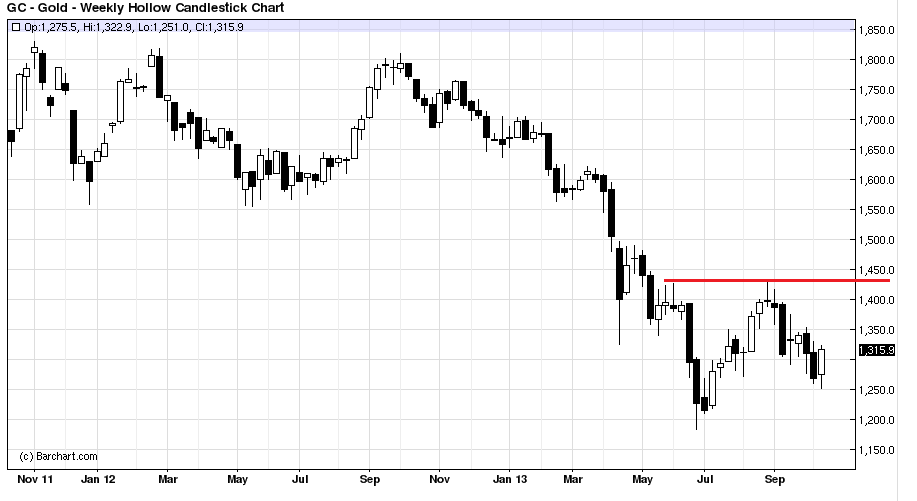
If we interpreted Gold as a fixed income asset (here is why), then it has a lot of upside potential. Gold also started rising in the past just before major economic slowdowns.
Here is a weekly chart of the December contract for Gold.
Friday, October 11, 2013
GDP
The chart above is that of the quarterly percent change in real GDP with a 4 period moving average (blue line).
The weakness of this recovery is clearly visible. The average has not reached the level of 1% (marked by the red segment) as it did during the previous expansions. This is coming after a very sharp contraction so it is not a good sign for the long term.
Also, the average has crossed the purple horizontal line from the upside during bear markets. It is now very close to it again. With the GDP expected to have slowed down in Q3, we might get a signal again very soon.
Wednesday, April 24, 2013
April 24 - it's time for another leg down
The deceleration in retail sales has continued since I last wrote about it.
Meanwhile, the stock market has been consolidating near its highs. It is time for it to play catch up.
Especially as the daily chart has become committed to the upside yesterday by closing strong and above a visible inflection point on the chart and also above the monthly resistance level at 1576.
Meanwhile, the stock market has been consolidating near its highs. It is time for it to play catch up.
Especially as the daily chart has become committed to the upside yesterday by closing strong and above a visible inflection point on the chart and also above the monthly resistance level at 1576.
Saturday, April 6, 2013
April 6, 2013 - slowdown confirmed, gold to bounce
The employment data that came on Friday generally confirms the slowdown I talked about in my previous post.
Here is a chart of a short term rate of change in employment. The series has further to fall.
From another point of view, this slowdown in employment may very well have marked the top for this recovery. Here is a yearly percent change in private payrolls (excluding health & education payrolls which are not cyclical).
The top is already in place from last year. In previous cases the series continued its fall.
During the previous bull it had topped in April 2006 and the market followed only more than a year after. This is why this bull market, even if quite old, has further to go.
Meanwhile, the price of gold has reached the bottom of a long trading range.
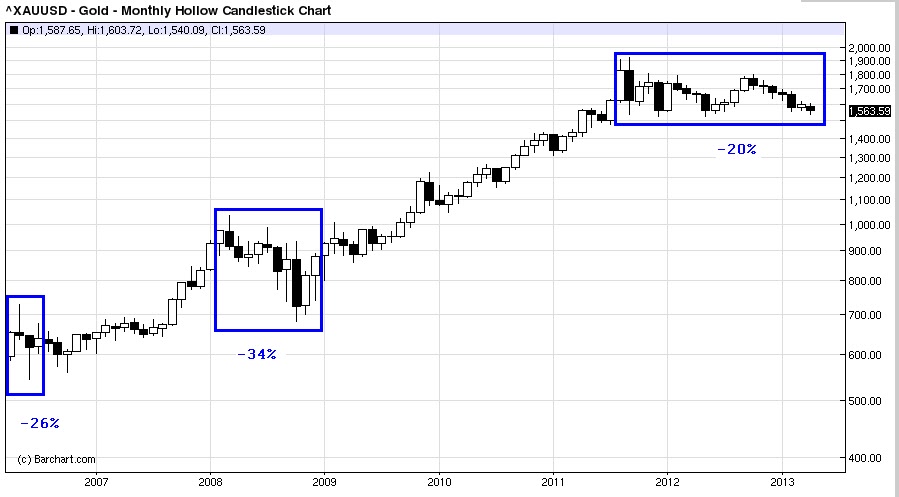
As I wrote in my previous post about gold, its price is rising in anticipation of economic weakness, and falls when the economy accelerates. I have anticipated the economic slowdown, but gold continued to fall. This may suggest further weakness this year.
But until then, gold is at important support and is a short term buy as it bounces during the correction in the stock market. Then, the time will come for another leg down as the correction on the monthly chart could be bigger than 20%.
Here is a chart of a short term rate of change in employment. The series has further to fall.
From another point of view, this slowdown in employment may very well have marked the top for this recovery. Here is a yearly percent change in private payrolls (excluding health & education payrolls which are not cyclical).
The top is already in place from last year. In previous cases the series continued its fall.
During the previous bull it had topped in April 2006 and the market followed only more than a year after. This is why this bull market, even if quite old, has further to go.
Meanwhile, the price of gold has reached the bottom of a long trading range.
As I wrote in my previous post about gold, its price is rising in anticipation of economic weakness, and falls when the economy accelerates. I have anticipated the economic slowdown, but gold continued to fall. This may suggest further weakness this year.
But until then, gold is at important support and is a short term buy as it bounces during the correction in the stock market. Then, the time will come for another leg down as the correction on the monthly chart could be bigger than 20%.
Tuesday, April 2, 2013
April 2, 2013 - correction just around the corner
It's been a nice 18% run, but it's over. The market is up against strong resistance and the short term breadth is awful. Such a pessimist tone is not appropriate because the bull is not over, but, still, a 7-10% correction is just around the corner.
I drew resistance on the monthly chart above. There were many other important levels that did not manage to shake the market for more than a few days, but this is the ultimate level - the high from 2007. The market will most probably rise and close above this level and then turn lower in the following days.
Here is an indicator of breadth that shows important divergence - the 13d ema of TRIN.
The weakness of this indicator has been disregarded by the market in the recent past. In fact, I was expecting a larger correction based on this indicator in my previous post. The big difference now is that the market has already risen by 18% and it is making record highs.
There are also some economic indicators that are sensitive to intermediate term fluctuations in economic activity. These are quite correlated to the market and they are suggesting a slowdown.
Here is the 3 month average of the New Orders vs.Inventories ratio,
the US PMI, which has turned lower recently,
the pace of change in Retail Sales, also turned lower,
and the pace of change in Employment (private payrolls)
Over the long term the bull is still alive. Employment in the US has been doing constantly ok and this should fuel the expansion at least until the end of the year. Overseas, The Chinese PMI has started to rise strongly and even the European economy is at the beginning of an acceleration phase.
Here is the Business Cycle Clock from Eurostat, showing the European Economic Sentiment Index (ESI), an indicator that leads economic activity and even the markets.
Thus, a correction that stays within the parameters of a bull market is a buy. It will probably reach the 1420-50 zone, but this level is just a wild guess for now.
I drew resistance on the monthly chart above. There were many other important levels that did not manage to shake the market for more than a few days, but this is the ultimate level - the high from 2007. The market will most probably rise and close above this level and then turn lower in the following days.
Here is an indicator of breadth that shows important divergence - the 13d ema of TRIN.
The weakness of this indicator has been disregarded by the market in the recent past. In fact, I was expecting a larger correction based on this indicator in my previous post. The big difference now is that the market has already risen by 18% and it is making record highs.
There are also some economic indicators that are sensitive to intermediate term fluctuations in economic activity. These are quite correlated to the market and they are suggesting a slowdown.
Here is the 3 month average of the New Orders vs.Inventories ratio,
the US PMI, which has turned lower recently,
the pace of change in Retail Sales, also turned lower,
and the pace of change in Employment (private payrolls)
Over the long term the bull is still alive. Employment in the US has been doing constantly ok and this should fuel the expansion at least until the end of the year. Overseas, The Chinese PMI has started to rise strongly and even the European economy is at the beginning of an acceleration phase.
Here is the Business Cycle Clock from Eurostat, showing the European Economic Sentiment Index (ESI), an indicator that leads economic activity and even the markets.
Thus, a correction that stays within the parameters of a bull market is a buy. It will probably reach the 1420-50 zone, but this level is just a wild guess for now.
Monday, December 17, 2012
December 17, 2012 - target 1522
The market seems to have tipped its hand since I last wrote. It has strengthened up after reaching intermediate term oversold levels, as shown in my previous post.
Here is a monthly chart of the SPX.
The bull market has a tendency to correct at long term resistance levels. The next one to the upside is 1522.
A move to this level would also represent a break out of a rising wedge - not uncommon for this chart pattern.
The economic picture has some points of weakness, but consumption, as a consequence of a continuing recovery in employment, is doing ok.
But this is a symptom of an ending recovery. Businesses have expanded their profits first, then they added equipment & software and then they started adding more workers, which led to higher consumption. Now, they are cutting back on investment and they will soon slow down on hiring. Here is a chart showing the correlation between capital expenditures and employment. Capex leads employment.
So, during the first half of 2013, employment reports will most probably get worse and worse. The market will ignore this for a while, since this means the Fed will stay easy, but the Wile E. Coyote moment will come, just in time for the upside break out of the wedge to fail, as it many times does.
Here is a monthly chart of the SPX.
The bull market has a tendency to correct at long term resistance levels. The next one to the upside is 1522.
A move to this level would also represent a break out of a rising wedge - not uncommon for this chart pattern.
The economic picture has some points of weakness, but consumption, as a consequence of a continuing recovery in employment, is doing ok.
But this is a symptom of an ending recovery. Businesses have expanded their profits first, then they added equipment & software and then they started adding more workers, which led to higher consumption. Now, they are cutting back on investment and they will soon slow down on hiring. Here is a chart showing the correlation between capital expenditures and employment. Capex leads employment.
So, during the first half of 2013, employment reports will most probably get worse and worse. The market will ignore this for a while, since this means the Fed will stay easy, but the Wile E. Coyote moment will come, just in time for the upside break out of the wedge to fail, as it many times does.
Wednesday, October 24, 2012
October 24, 2012 - time to go long
Update: October 25, 1:35 pm - I did not buy the break below 1400 and I am sitting on the sidelines at least until tomorrow. The intraday reading on the cpc is at the overbought level while the market is falling - this usually is a setup for continuation to the downside.
The bull has paused a bit after the good news in September (economy expanding, the Fed easing further). The market usually does so as the news becomes undeniably good.
This being said though, I think the market has reached the point from where it should start rising again. The set up looks pretty good: there are many who are calling for a longer drop from here, the market looks committed to the downside, the futures contract has reached strong monthly support, indicators are oversold and the economy still looks strong
Here is a daily chart for the SPX, showing commitment below 1425
and a monthly chart of the December contract, showing important support at 1404 being reached
There is also a buy signal from the 13 day ema of TRIN, which has become oversold yesterday:
This market setup is coming in the context of a still strong economy, one that does not yet show signs of going into recession. Here is a chart of the pace of change in real retail sales, showing a still strong rhythm of growth.
The series has a bit more to grow before a slowdown in economic activity can be anticipated.
Now I have to admit that this bullish scenario is supported mostly by technicals (breadth, market behavior, support levels, sentiment etc.). The fundamentals that lie ahead are not very encouraging: the fiscal cliff and decreasing earnings.The market has chosen to ignore these until now. Will it do so in the future too? Who knows?
Anyway, the technical setup will lead to at least a bounce from here, so the risk is very low. A drop below 1400 on the December contract is a good point to buy. This may happen as the Fed makes its announcement today.
The bull has paused a bit after the good news in September (economy expanding, the Fed easing further). The market usually does so as the news becomes undeniably good.
This being said though, I think the market has reached the point from where it should start rising again. The set up looks pretty good: there are many who are calling for a longer drop from here, the market looks committed to the downside, the futures contract has reached strong monthly support, indicators are oversold and the economy still looks strong
Here is a daily chart for the SPX, showing commitment below 1425
and a monthly chart of the December contract, showing important support at 1404 being reached
There is also a buy signal from the 13 day ema of TRIN, which has become oversold yesterday:
This market setup is coming in the context of a still strong economy, one that does not yet show signs of going into recession. Here is a chart of the pace of change in real retail sales, showing a still strong rhythm of growth.
The series has a bit more to grow before a slowdown in economic activity can be anticipated.
Now I have to admit that this bullish scenario is supported mostly by technicals (breadth, market behavior, support levels, sentiment etc.). The fundamentals that lie ahead are not very encouraging: the fiscal cliff and decreasing earnings.The market has chosen to ignore these until now. Will it do so in the future too? Who knows?
Anyway, the technical setup will lead to at least a bounce from here, so the risk is very low. A drop below 1400 on the December contract is a good point to buy. This may happen as the Fed makes its announcement today.
Thursday, July 19, 2012
July 19, 2012 - after the slowdown comes the acceleration
I started talking about a slowdown in the economy during spring this year. Judging by some indicators I watch, this slowdown has come to fruition.
Here is the pace of change in Real Retail Sales,
and the CPI.
The stock market usually anticipates and accompanies these indicators as they move lower. This time was no different.
Simce the indicators reached the lower boundaries of their intervals of variation, the next move will be up. This would mean some good news for the economy until the autumn, but I do expect this bounce to be weak. Anyway, it will push the stock market higher and help lure in some imprudent bulls.
Friday, June 15, 2012
Update (June 15, 2012)
The growth rate for retail sales is decelerating towards the lower boundary but it is just half-way through.
The market rallies many times advance of the turn in the series but it has to reach closer to the "oversold" level.
Meanwhile, the market fell after gaping up on Monday but it never really came to the sellers, so I expect to see another dive next week, maybe even before the Fed meeting.
I think that a break above 1342 (September contract) is a nice point to sell for a drop to 1300.
This would be a trade taken against the 1332.75 resistance on the monthly chart (monthly levels are usually broken by 10-15 points before the market reverses).
Friday, June 1, 2012
What's next
Probably some short term "bounce" in economic activity. Here is a leading indicator:
But, first, a drop in retail sales pace of change too.
Thursday, May 31, 2012
Saved by the revision
After the first estimate of the Q1 GDP I posted this chart, noting that the series has made a first downtick and that a second one would signal a recession.
Below I updated the chart after today's release. The downtick is gone!
The headline number for the just released revision may be weak but there are some improvements under the hood.
Subscribe to:
Posts (Atom)