Showing posts with label weekly wrap up. Show all posts

Monday, July 18, 2011

Weekly Wrap Up, July 11 - July 15 2011

Economy: Retail Sales report suggesting future consumer strength

The pace of change of real retail sales has started to slightly accelerate from between the green horizontal lines, a turn that usually suggests the series will rise in the near future.


S&P500: The market looks prone to play the range-bound theme

As the weekly SPX chart above shows, the initial powerful thrust upwards (green ellipse) has not had follow through (red ellipse). Since breadth has been weak lately and since it stayed weak, as the TRIN 13 day ema suggests, the market will most probably retrace towards the bottom of the range shown above.


Looking Forward

Next week will be marked by an ongoing earnings season, ongoing negotiations over the debt ceiling, by housing data and by a big EU summit on Greece. I think the market will anticipate/react to most of these events by falling. Only the EU summit may induce some upside for the market as it will probably try to anticipate a positive outcome.


Trading

I will be looking for short-term short entries on Monday or Tuesday. Although there were some good pull backs last week, I deferred shorting as I expected the incoming economic data and Ben Bernanke's testimony to represent reasons for a multiday pull-back.

As the market fell this last week, it seems that smaller pull-backs were 10 points long and a larger pull-back was 20 points long. At Friday's close, the market had already retraced 10 points from the intraday low on Thursday.


Sunday, July 10, 2011

Weekly Wrap Up, July 5 - July 8 2011

Economy: Bad employment number

Despite the bad NFP number for June, the average pace of change in private payrolls is showing just some normal volatility as it did in previous expansion cycles.

S&P500: The market is ready to power higher

Previous up legs closed higher almost every week after the inital rally off the lows.

Shorter term, the 1341 SPX support on the daily chart was not broken while the market registered a normal 20 points correction:


One Week, One Stock: Intercontinental Exchange (ICE) - looking good

Yearly sales growth is expected to register a mild slowdown in FY 2012, which does not look ominous and should not bring earnings surprises.

Using the historical P/E range and an estimate for the EPS at the end of FY12, I got an average price target of 166.


I discounted the Zacks.com EPS estimate by 10% in order to be conservative. At 128, Friday's close, the stock looks undervalued. Also favoring the upside is the recent trend of estimated EPS revisions:

source: Zacks.com

Looking Forward

Next week we get a Ben Bernanke testimony, a retail sales report and a CPI report among other data. I think the market will anticipate these events by moving up.

In light of the recent employment report, I think the market will rise into BB's speech. Also, there are strong expectations from the retail sales report and I expect the CPI to come in showing a further slowdown in its average pace of change.


Ideas

(continued from last week's wrap up, ideas section)

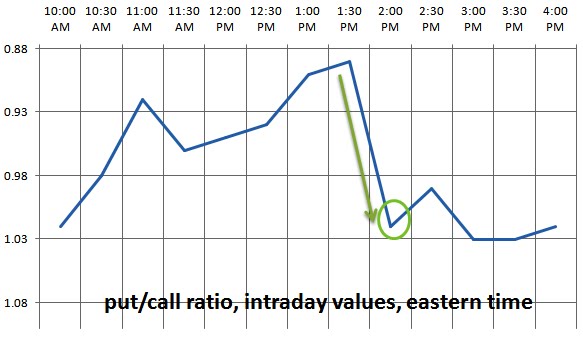
The intraday movements of the put/call ratio would have suggested long entries starting at 2:00 PM, eastern time. Not bad!


Trading

I am long from 1330.5 ES (entry posted here).

I will be looking for opportunities to further add to this position as the market confirms Friday's after-the-lunch strength.

Saturday, July 2, 2011

Weekly Wrap Up, June 27 - July 1st 2011

Economy: ISM New Orders vs Inventories ratio suggests future economic strength.

The ratio above is at levels from where it usually starts to go up, meaning that in the near future businesses will be faced with increased new orders compared to their inventories. This means rising capital expenditures, employment and inventories, in other words, increased economic growth.

S&P500: Strong week pointing higher.

Last week market action was very strong. As seen in the chart above, previous such strong weekly candles coming after greater than 7% corrections led to more upside.

Generally, strong bull legs are followed by weaker ones (purple arrows). In 2010 the market went up 17% after the 32% rise in 2009. Now, after the 30% rise from September 2010, a 15% rise would put the market at 1446.

Breadth was strong: in just one week there were 2 consecutive days with greater than 80% up volume and one day with greater than 90% up volume.

One Week, One Stock: First Solar, Inc. (FSLR) - looking bad

Sales growth is expected to slowdown a lot in FY 2012 ...

... while operating margins are dropping fast on a yearly and quarterly basis ...

... and EPS estimates are revised down

However, the market already knows it and the stock is down ...

... so it may get close to a buy point as soon as the problems with operating margins go away.

Looking Forward

Two major events next week:

> European Central Bank meeting: a rate hike is in the cards. Corrections of about 1% or to the 1.44 zone, before the announcement, are buying opportunities for EURUSD.

> US Employment Report: My current view is that the market will anticipate a strong number since other indicators for June were strong. I will buy SPX on pull-backs before the announcement.

Ideas

Time the intraday market swings by fading spikes in the put/call ratio (detailed post here)