Showing posts with label spx trading. Show all posts

Wednesday, October 26, 2011

Not a Bear Market Anymore

I did not have too much time to post lately. In fact, this will be the case from here on and I am thinking of discontinuing this blog or post much more sporadically.

Meanwhile, the so called bear market rally has metamorphosed into something else, invalidating my long term expectation of a bear market. Here is a reliable indicator suggesting the move up in October has been more than a bear market rally: percent of S&P500 stocks above their 50 DMA.


The purple line usually contains this indicator during bear market rallies. Notice the recent strength above the line.

This is not the only indicator suggesting the same thing. So, from here on I will buy daily pullbacks, at leat until the 5 day ema of the total put/call ratio moves towards the upper part of my inverted chart below. In fact, I already bought today at the 1216.5 daily ES support.


Wednesday, October 5, 2011

Down, Then Up

Nice move up yesterday but, looking forward, today the market may fall back below 1100. Here are some previous cases of strong one day reversals and what happened after them.

The pattern is down today and up again starting tomorrow. The only time this pattern failed is when the day after the reversal opens with a big gap up. Today, this will probably not be the case.

The NFP report on Friday might also deter buyers, since recent numbers have been quite bad.

Thus, I will take profits on my longs on a rally, even before the US open, if the market rises back to 1123.

Tuesday, October 4, 2011

That's more like it!

A 50 points rise in the last hour of trading must mean something. As a side note, that usually happens in bear markets.

Still, given the very strong close, a trend day down tomorrow is not excluded, but, generally, the market is headed towards 1250 over the next weeks.

Monday, October 3, 2011

Fuel For The Next Rally

The Chinese PMI is turning from the lower bound of its interval of variation. I think this will be associated with some economic activity acceleration in the US over the next several months. This will support the equity markets before the next leg in the bear market.

With the stock market near the lows of its recent range, I will look for long entries today and/or tomorrow, keeping in mind that a low may be marked by the NFP report on Friday.

Wednesday, September 28, 2011

Ready to Reenter Long

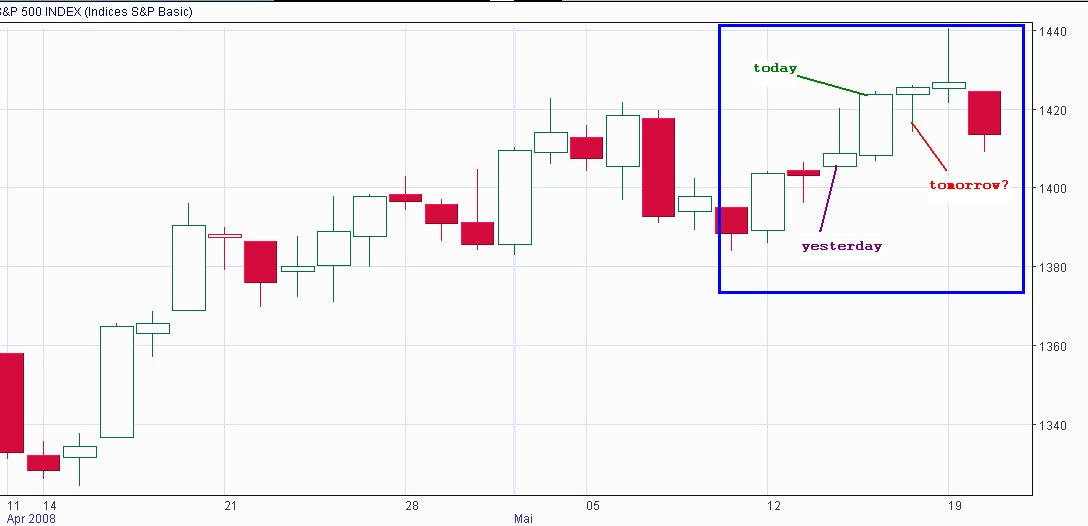
Now that the danger has been averted and the market did not fall further, I will look to reenter my long today. The 3 day fractal, of which today is the second, may play out like this (May 2008):

There is a high resemblance between the market action and closing hour on yesterday and on the 14th of May 2008, the first day in the fractal highlighted above.

Another factor suggesting a continuation of the rally is the vote in the German parliament on the EU sovereign debt rescue plan. The market will most probably rise in anticipation.

Monday, September 26, 2011

Shaken-out

The market was strong after I exited. I will look to reenter on the first pull-back of about 5 points.

Sunday, September 25, 2011

Bear Market Rally Still Not Over

The market is in a bear market and is starting to fall very fast, but I still feel like looking for longs, playing a continuation of the bear market rally. This is not just gut feeling, of course. I have shown two indicators in my last post suggesting that the market has not been overbought and that the economy has some positive news to provide.

Back at the beginning of August I was thinking that the FOMC meeting will mark the end of the rally. The Fed has failed to deliver, indeed, but the market technicals are not aligned for a new downleg. I now think the market will be supported by the anticipation of some positive outcome in the European crisis over the next weeks. All until the first advance estimate of the Q3 GDP comes at the end of October - maybe we will get an answer as to whether the anticipated economic acceleration is taking place. I expect this event to mark the top of the bear market rally.

Meanwhile, I will start to go long next week, whenever conditions are favorable. In fact the first opportunity to go long presented itself on Friday but it would have been too risky to hold longs over the weekend.

Given the way the daily chart looks right now, a marginal brake of the August lows cannot be ruled out, before the move towards 1200 starts again. I personally do not have any clue to tell me if that will happen or not. I will leave it all to chance and let risk management do its job.


Tuesday, September 20, 2011

Analogy

Here are a few analogues from 2009-2010, with the candle corresponding to yesterday's trading circled in green.


In two of the cases, the market was two days before a FOMC meeting., just like today.

This suggests that the market may correct starting on Wednesday, after a move up today. The strength is not guaranteed for tomorrow too, given the analogues above and with the SPX hitting the 50 simple DMA around 1225. Thus, I will take profits today if the market reaches 1223 ES.

Looking further, the bear market rally will continue after a few days of downside. The 5 day ema of the total put/call ratio is far from overbought ...

... while the economy has some positive surprises coming first.


Monday, September 12, 2011

Still Bullish

Patience and luck have kept me from buying on Friday. These are two essential ingredients for successful trading, although only one can be controlled by the trader himself.

I am willing even to push my luck, given that I am now in a much better position to risk money on the long side, since, if my bullish bias is still right, most of the downside has already come to pass.

The put/call ratio suggests the market is oversold and ready to bounce. The Fed meeting next week will attract buyers this week, or, at least, will deter sellers.


I think anything today around or below 1335 ES (December contract) is a good price for a long position.

Friday, September 9, 2011

Bullish

I think the market is heading to new highs for this bear market rally. I will look to buy today in the 1180 zone. If the market does not hold this level, the sell off might continue deeper toward 1160.

The total put/call ratio made a "bearish spike" yesterday, supporting the bullish scenario.


Friday, September 2, 2011

Bear Market Rally Not Over

I saw some comments throughout the online financial media stating that the bear market has probably made a swing high this week and that we should look for new lows from here. I do not agree. There is no intermediate term indication of an oversold market.

Here is one indicator, the cpc 5 day ema, which is still depressed. It will have to reach close to the upper horizontal line before a top is made.


Until then, deeper pull-backs lasting a few days are buying opportunities.

Wednesday, August 31, 2011

The Poem for a Shake-out


[...] some unhappy master whom unmerciful disaster
Followed fast and followed faster till his songs one burden bore -
Till the dirges of his hope that melancholy burden bore
Of "Never-nevermore."'

Fragment from The Raven by E.A. Poe

------------------

Still, I am not saying "nevermore" and am ready to short again after a probable lunch rally, if everything looks right.

Tuesday, August 30, 2011

Ready to Short

I am looking for a short after the FOMC minutes at 2:00. The market is already stretched to the upside and the ISM data on Thursday will most probably be anticipated by the market by dropping, given the ugly regional surveys already available from Richmond, Philadelphia and New York (Chicago is reported tomorrow).

1213 ES is my favorite level, but I would take anything around 1210.

Monday, August 29, 2011

Choppy

Bear-market rallies are usually choppy. The market can do anything.

Here is how a daily chart looks now for the S&P500:

And here is what happened in March 2008 after a similar pattern

This is not a reason to short today, especially given the Globex rally, but bulls should be careful as pullbacks can turn into much deeper sell offs.

Tuesday, August 23, 2011

Update

It seems I have been shaken out by the earthquake. Literally.

Monday, August 22, 2011

Time to Go Long

I believe it is time to start looking for long entries. The market is oversold according to the total put/call ratio 5 day ema:


Also, the market will have a general upward bias heading into Friday's Jackson Hole speech.

A good level to enter is the lower end of the overnight range, around 1110. If today gaps up and keeps going, an opportunity to go long might come up tomorrow, but from higher levels.

The next development in this bear market rally is a move up to 1200 and above. The rally will continue until the cpc 5 day ema above approaches the upper horizontal line.

Tuesday, August 16, 2011

Intermediate Term Bear-Market Rally


The overbought and oversold levels for the 5 day ema of the put/call ratio (chart above) are lower for the bear market, so I adjusted them accordingly.

This indicator reached oversold and the market started to rally, so I think we are now in an intermediate term bear market rally. These go up 10-20%, last for 1-2 months and are volatile.

Shorter term, the simple put/call ratio suggests there is more upside in the coming 1-2 days.

The green arrows highlight the ratio moving contrary to the market. A deeper daily correction usually takes place after a bigger spike to the upside on the inverted chart. Thus, today's gap down is a short term buy, but a fast rally to 1220 is a sell.

The bear-market rally will resume its course after a 2-3 day deep correction on the daily chart.

Saturday, August 6, 2011

The Bear Is Back

Last post before I go. If the recent market action was not enough to convince people that the bear is back, here is some more factual evidence.

All my indicators reached bear market territory. Here is an important one: 52 week NYSE New Highs - Lows.

Notice the different behavior compared to August 2010, when the sell off in the market was even bigger. Back then, NYHL came after it had made new highs for the bull market and did not go too much below 0. Now, it is coming after big divergences versus the market and has reached well below 0.

Friday, August 5, 2011

Update

No entry today. The market did not behave as expected. Also, the put/call ratio is no longer oversold near the close, suggesting some more weakness at the beginning of next week, although probably there will be no new lows.

I will not be able to trade or post consistently next week. I will be back on next Sunday or Monday.

Oversold

With the intraday reading on the cpc ratio currently at 1.5, the 5 day ema would look something like this:

Finally oversold. This warrants some small size bottom picking, today, after the lunch. My favorite level is 1177 ES. The market is already there but it is risky to go long just ahead of lunch time.

This being said, I will look for a strong rally to close the day. I expect a 10 % rally to start from here and go on until the end of September.