Showing posts with label sentiment play. Show all posts

Friday, July 13, 2012

Update (July 13, 2012) - a contrarian sign

The latest cover from The Economist is not a good sign. Here it is.


And here is the cover from June 2007. Somewhat similar.


Everybody knows what happened afterwards.


This contrarian sign just brings more confirmation to the bear-market thesis. In the same vein, the rally off the 1250 lows is looking weak. Here is a ratio of two etfs: consumer discretionary items and consumer staples (XLY vs. XLP).


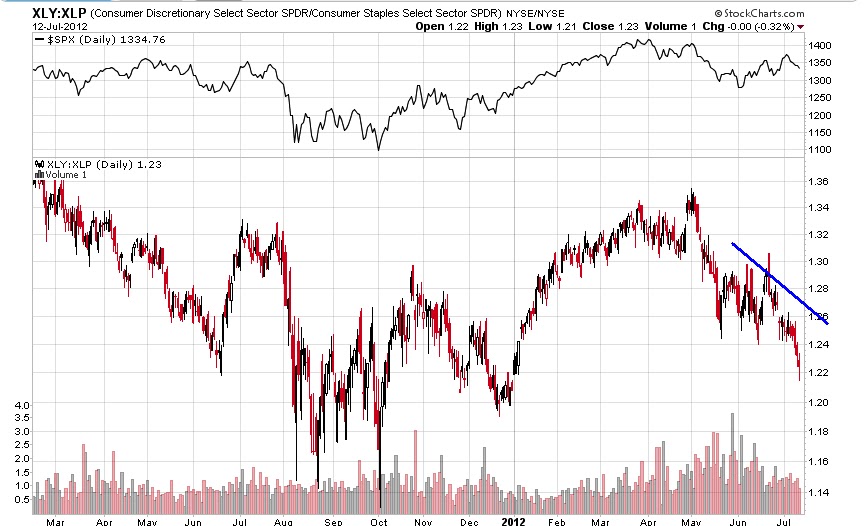
The underperformance is obvious. It usually is this obvious at important turning points.


Will the rally continue? I think so, given that intermediate term indicators are not yet overbought. I believe a higher low was made yesterday.


The 5 day ema of the put/call ratio will probably reach the overbought level for bear markets first before the market tops out. Just in time to turn most of the participants bullish. In fact, one can always count on the majority's incredible ability to become overoptimistic at important tops.


Thursday, February 24, 2011

ST Trading the SPX; Sell Oil

The market is reluctant to go up and its behavior is not exactly what I had envisioned. The pull back from the highs is already 45 points long, much bigger than other similar moves at previous tops.

The put/call ratio is oversold, but it does not imply that the market cannot continue downwards.

However, I will still have a bullish short term bias as long as yesterday's SPX lows hold. I will try again to go along as soon as I see some convincing positive action today.

Meanwhile the price of oil has gone wild. Here is a weekly chart of the April contract

I agree with Mr. Futia's analysis regarding market sentiment towards oil. I do not know about long term (years) but over the intermediate term his conclusions match my expectations of a weaker economy for a while.

This means that a good trade idea would be to sell oil. I have measured the previous up moves for this contract and the latest rally seems as big as it can get at current levels. I think a top may be in the cards even today. By my calculations, selling above $104 is a bargain.

The easing in oil prices might also spark a short term rally in the stock market.

Wednesday, February 23, 2011

ST Trading for February the 23rd

The put/call ratio is oversold after yesterday's big drop.


Bearishness rules again judging by the most read news stories on Marketwatch.com


Also, given that the market topped during lunch time on Friday, I do not think the market is going to continue down from here over the short term. I think there will be good opportunities to go short for the intermediate term at higher prices.

This is why I will try to go long today as part of my short term trading strategy. I will only do it after a decent pull back, preferably below yesterday's close.

Thursday, February 3, 2011

Hysteria

While thinking about the more important events in 2010, I realized that there were several hysteria among market participants. Here is how they were reflected by the covers of The Economist and how the markets behaved after that:

> February 2010: China Hysteria
- the cover

- the market: SSEC vs SPX

> April 2010: The US Recovery Hysteria:

- the cover
- the market
> June 2010: The Double-Dip Hysteria

- the cover
- the market
> July 2010: The Euro Default Hysteria

- the cover
- the market: EURUSD
> October 2010: The Weak USD and QE2 Hysteria

- the cover
-the market: USD Index
> December 2010: The 2nd Euro Default Hysteria

- the cover


- the market: EURUSD
Pretty good consistency! What's the next one? At the moment I think it is food price
inflation. Again, the timing seems great with the looming correction and economic
slowdown.

Friday, December 31, 2010

Another Sell Signal

This is for the intermediate term and it usually leads the actual top:

The above is a title from the home page of Le Monde, the main non business journal in France. They almost never focus on the stock market outside the economic section.

Sunday, November 14, 2010

Something Is Rotten in the State of (Denmark) China

Media exuberance over China continues unabated,

while the Chinese economy flounders.

Leading Indicators for China

Luckily, the US is around:

Leading Indicators for USA

The unknown unknowns are the most dangerous and China is becoming one. 2011 should be fun to trade!

Thursday, October 28, 2010

Media Too Bearish For a Top Yet

I am stunned by the resilience of the bearish sentiment despite the fast rally from 1040. Here are just two examples: today's most popular articles on MarketWatch and WSJ Markets section.

- MW:
- WSJ:

Scepticism towards the economy and the rally is at the top. There is also a lot of scepticism towards the new round of QE.

If sentiment continues to stay like this the market will just bounce back up after each small correction. Usually what flushes this bearish sentiment is a bigger correction followed by marginal higher highs. I think this will be the path after the Fed meeting on Wednesday.

Monday, September 20, 2010

The LeMonde Omen

Since everybody has been looking for omens lately, I have just stumbled upon one of my own:


This is a title from the economic section of the electronic edition of the French newspaper LeMonde (click to enlarge).

It seems bullishness and hope have reached far enough for the market to stage a correction this week. A steep one, since this is a bear market rally.

Friday, August 20, 2010

Contrarian Signal

Here is the first article on the page of LeMonde.fr (click to enlarge):

The title says: "Markets depressed despite rising profits".

I read this French online news site everyday. It rarely features the stock market on its home page. When the bearish sentiment is so strong that it reaches the home page of a French non-economic news site, it is time to go long.

Tuesday, August 10, 2010

Expectations on Fed Behaviour: QE 2.0


Here is a collection of article headlines I put together while browsing the online financial media:

forbes:


wsj:
smartmoney:

barrons:
reuters:
nytimes:
bloomberg:

The main idea is clear: the Fed should do more quantitative easing as deflation is looming and the economy has gotten weaker. This suggests that expectations are oriented towards higher bond prices and a lower US Dollar.

Given the prevalence of this view at the moment and taking a contrarian approach, I would bet on falling t-notes prices and a rising dollar for a while. I would also not expect the Fed to talk down the economy as the latest economic reports (especially the GDP report) were not bad in the current context and, in fact, had some bright spots.

Sunday, August 8, 2010

Trade Idea: Short US T-Notes

I have noticed lately the increasing tendency of the media to acknowledge the risk of deflation. Compared to a few months ago when the tilt was clearly towards inflationism, this is a major change. While I think the deflation camp has a solid case, this new obsession offers a trading edge for the contrarian trader, even if only for a shorter period.

The deflation scenario is supported by falling interest rates and a slowdown in the economy. The media has been prompt in highlighting both. They also stress the need for more quantitative easing and the latest job report headline number gives them an excuse to march on this theme more confidently.

All this is reasonable thinking, but when it comes to markets what is reasonable does not necessarily make you money.. The bond prices have started rising when the inflation hysteria was flourishing. Now, as the majority became more aware of it, the deflation risk scenario may be already priced in. Surely, if the deflation scenario materializes the bond prices may go further up but at this moment a good shorting opportunity emerges.

The chart below presents the continuous contract for the 10-year US treasury note (chart courtesy of SaxoBank):


I have delimited by the blue horizontal lines the range in which the market traded at the beginning of 2009. Note that currently bond prices have almost reached the top of this range. I think this area is a good entry point for a short, probably on a rally after the Fed announcement on Tuesday. The red segment highlights a possible move to the bottom of the range.

Thursday, July 29, 2010

Economic Pessimism and the Economic Reports


The most recent durable goods report is taken as a confirmation of the slowdown ahead. Indeed:

click to enlarge

Highlighted with blue are the last three monthly changes in the value of total durable goods new orders. May and June have registered decreases.

However, if we take a look at the details we see that these decreases are mostly due to the non defense aircraft and parts component:

click to enlarge

Note that values for this sub-sector have high volatility from month to month. In April they increased by 215% for example, pulling the total value of durable goods orders up and inducing the feeling that April was a positive report when, in fact, as I remember it, it was not so good.

So, to avoid being mislead I look into detail at economic reports. For this one I look more attentively at non defense capital goods excluding aircraft:

click to enlarge

This is a good measure of business investment. This time June and May do not look so bad.

Nevertheless, the media has taken the opportunity to add this report to the evidence of a recession coming. I think pundits have become sure of this recession and do not abstain to mention it every time. I see titles in the media like: “What will car-makers do during the recession”, or magazine covers like:

click to enlarge

Note the expressions on people's faces.

This suggests the pessimism towards the economy is very high. While pessimism will be an important ingredient in the coming downturn, at this point, from a contrarian point of view, I would expect some positive surprises in the economic data. The surprises seem to have started with the new home sales and they could continue with the GDP report on Friday.

Friday, July 16, 2010

Buy the US Dollar

source: ProRealTime.com

Here is a chart of UUP (black), an ETF tracking the US Dollar. Click to enlarge.

The indicator plotted in blue is an average of the monthly and bi-monthly rate of change (comcept inspired from Will Rahal's blog). Note that this indicator reached a level (green horizontal line) that corresponded to turning points in the past, thus suggesting a possible up move for UUP.

The average ROC reaching this level would hardly mean much by itself but there are 2 other developments that indicate a turning point for the US Dollar:

1. The most powerfull one is the shift in sentiment towards unfavoring the dollar. Here is some evidence. Also I have noticed that articles favoring other currencies (like Euro and Yen) have become very frequent recently.

2. Some downside in the stock market would be favorable for the dollar given the recent correlation. As stated in the previous post I am expecting a correction.

Consequently, I think UUP will bounce from the zone delimited by the two horizontal segments on the chart. 23.9 looks like a good entry level. This is a short term play (a few days).