Showing posts with label IT Trading. Show all posts

Monday, March 21, 2011

Market Outlook

I think the market will rally until we see a big spike in the total put/call ratio, maybe to the 0.8 zone:

Also, we need to see the 5 day ema of the put/call ratio move from the deeply oversold condition:

After that, the market will most probably trade lower. It is my conviction that the correction is not over yet.

Friday, March 18, 2011

The Context

Here is a short summary of the economic and technical context.

Real retail sales have continued to rise slower on average.

I think the series can even reach the lower extreme, although that is not a certainty.

CPI has accelerated its rise and the pace may stall for a few months before slowing down.

This evolution will probably mask a faster rise in core CPI than in the food & energy component which has already made its move.

This might be associated with a rally in the dollar starting in April, but from lower levels.

Meanwhile, the intermediate term correction in the stock market is well underway. The SPX was pushed over the edge by two external shocks.

I marked the intermediate term corrections in this bull market. This correction is already big but it can be bigger and not be an exception.

Still, there are indicators suggesting the market is oversold, so, technically a bottom is not much lower. Here is one of them:


Short summary of the above: the economy has not slowed down enough and the stock market has not corrected enough for aggressive intermediate term long positions but the market is oversold and a multiday rally is in the cards.

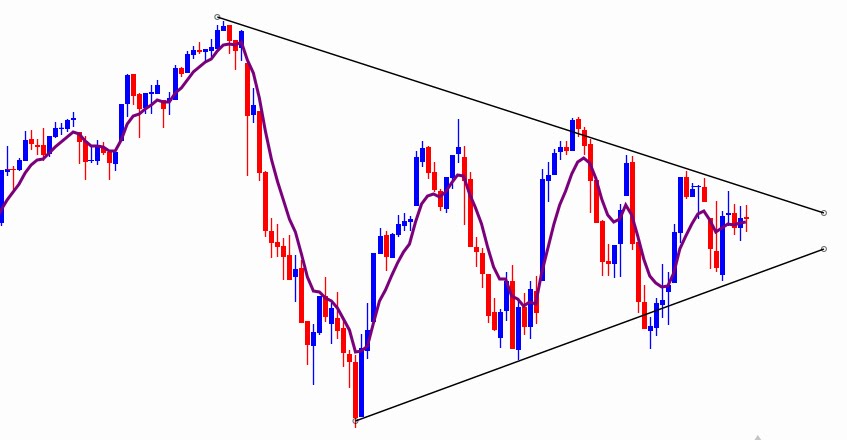
Here is a possible road map for the SPX for the following months. We might be at the blue circle:

I'm showing this just as an example of what the market can do. The only factor pointing towards this scenario is my expectation of volatility in the stock market until the end of this summer.

Monday, March 14, 2011

The Fed Effect, Second Try

I lied when I said I would update the real retail sales chart over the weekend! I forgot I needed the CPI numbers. While an estimate of the CPI can be made, there is no rush, so I will wait until Thursday.

The market seems ready to head even higher with the put/call ratio oversold:

I think today's probable gap down is a buy, especially with the Fed meeting tomorrow.

I talked on Wednesday about what I called the Fed effect. These days this effect means a weak dollar and a rising stock market. I was two days early, but the effect is there:

USD futures, 60 minutes chart.

As long as the Fed does not change its language towards inflation, the dollar will weaken further. I think there is a too small probability for this change to happen at this meeting. The inflection point in this trend, and probably in the dollar's downtrend, will be after the ECB meeting in April. April is also close enough to the end of the QE2 program and traders may try to be ahead of the curve and buy the dollar earlier. Meanwhile, the stock market may even make marginal new highs.

P.S.: I will not be at my desk tomorrow and Wednesday, so the earliest I will post again is Thursday.

Thursday, March 10, 2011

Break Out?

Everybody has this question in mind after the latest multiday coil in the SPX:

The market prepared for break out yesterday as it was all over the place during the session. The rhythm was indeed strange.

As I said previously, I expect a decisive break out to happen after the FOMC meeting, but at this point, with the market carving a top for the last three weeks, I would not stand in the way of any big gap down.

Wednesday, March 9, 2011

The Fed Effect

As long as the market stays above 1316 ES, I am maintaining my belief that the path of least resistance is up in anticipation of the Fed meeting on Tuesday. The put/call ratio is still favoring a move up:


Traders also seem to have started to anticipate the meeting, as suggested by renewed weakness in the USD Index futures (60 min chart, March contract):


Tuesday, March 8, 2011

50 DMA?

Analogies are working until they don't. It seems the resemblance with the May-June 2009 market action was broken yesterday.

I still expect the market to not fall significantly further until the Fed meeting next week, but a bigger correction is overdue and what we are seeing these days is the volatility before such a correction.

The market may just need to touch the 50 DMA first and then head higher until next week.

Maybe something like this:


Monday, March 7, 2011

May 2009 Reloaded

The market action resembles more and more the May-June 2009 top.

After an initial period of zig-zag (blue line) the market dropped and then moved up for three days in a row (green arrow). I do not know if the next three candles will be the same now but a move up looks very probable.

Indeed, the futures are up as I am writing this and next week there is a FOMC meeting. Also, there is no important economic data released until Friday and the employment report was strong. Moreover, the put/call ratio is not overbought. In short, a recipe for a rally this week.


Meanwhile, the volatility has significantly increased, a behavior that precedes more important tops when it comes after a sustained move up with low volatility.

Friday, March 4, 2011

Update

Strong employment report anyway you look at it. There are two interpretations:

> the growth momentum will not fade away and the Fed does not act for some time - bullish for the market over the IT;

> the Fed will start heading towards a more hawkish path quite soon - bearish for the market over the IT.

We might get more clues after the FOMC on March the 15th.

Top Scenario

The put/call ratio is suggesting more upside, since yesterday, after a big move upwards, the ratio decreased on my chart:

Yesterday also showed some weakness, with the upside volume only 88% of the total NYSE volume. This is characteristic of a top formation.

If the market is not ready to top at the recent highs around 1340, I will be looking for something like this:


Thursday, March 3, 2011

Changes For ST Trading

Nice overnight rally! Again, without me. It seems I have a problem with the exits for my Short Term Trading. Recently I anticipated well the short term variations but the market kept kicking me out before the bigger moves. The noise is bigger as the time frames become smaller.

I introduced my ST Trading strategy here, about two months ago. Until I have a longer track of positive performance with this strategy, I will stop posting the trades on the blog. I will still post the Intermediary Term trades, my main focus, for which the short term volatility is not as significant and with which I have achieved decent performance over the years.


Back to the markets, the path I anticipated seems to be very accurate. The market is up significantly as I am writing this and I expect it to reach at least the recent highs.

I expect all this to be a top formation. If conditions look right, I am ready to go short around or above 1340.

P.S.: The rest of the blog stays the same.

Wednesday, March 2, 2011

Weakness In Consumption; Buy the SPX

The pace of change of real personal expenditures on durable goods slows down as expected:

The stock market does not acknowledge this yet, but I expect it to do so in the following months. Still, I think the recent weakness is a short term buy. The prospect of a good employment report may pull the averages higher. The put/call ratio also favors the scenario of a rally:

I think the highs at 1340 will be reached soon.

Tuesday, March 1, 2011

Market Outlook

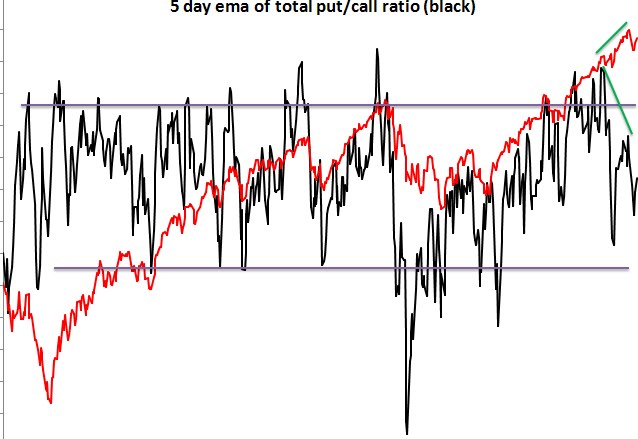
Big divergences in the 5 day EMA of the put/call ratio usually precede important corrections:

I think the next good opportunity to sell will be after a spike in the simple put/call ratio. Something like this:

Meanwhile, today I expect a steep drop, followed in the next days by more upside. The employment report may coincide with an inflection point.

Friday, February 25, 2011

The Rodeo

It seems to be true that the market shakes out most participants before a bigger move. It is like a rodeo and I was thrown off.

The put/call ratio is still oversold and the market finally shows strength today:

I think the gap up will force some shorts to cover, which will push the market even higher. If the market stays strong in the following days, it will give valuable information for the intermediate term top I am expecting. Should the recent highs be reached fast and with weak breadth the descent will be dramatic.

Tuesday, February 22, 2011

Market Outlook

The pace of change in real retail sales is slowing down as expected:

The stock market has some catching up to do.

I expect the market to be very volatile in the next few days, as volatile as it has been at recent more important tops (January 2010, April 2010).

The action might resemble the last 2 weeks of January this year, although I think this time the break out will be to the downside.

The amplitude of the range was 25 SPX points back then. I noticed that this value is a good approximation of other similar ranges, so 1320 SPX could be a short term buy today or tomorrow for a move to the recent highs.

Saturday, February 19, 2011

The Yield Curve, Inflation and the Stock Market

In the first phase of an usual economic recovery the stock market marches on the "growth and low inflation" theme. I cannot say that the current economic recovery is usual but the theme seems to have been the same; especially since low inflation has implied very accommodative monetary policy. Eventually however, this theme becomes "old- fashioned" and the markets correct.

We can gauge if the markets are playing this theme by looking at a long term yield curve chart (yield curve defined as the difference between 10 y rates and 3 mo rates):

When the yield curve steepens (the series rises) the "growth and low inflation" theme is what the markets are pricing in. It happened in 2003-2004 and it has also happened until recently.

However, a time comes when the economic recovery goes on to the next phase: "growth and rising inflation". This is visible on the chart after the beginning of 2004 as the series started falling. This second theme still means rising stock market prices over the long term but the transition involves a correction.

Here is what the SPX did after January 2004, when the yield curve started falling:

Since the yield curve has steepened (risen) a lot lately and has reached levels that represented turning points in the past (black line on the first chart), I wondered if we could expect the same shift between themes now.

One gauge is the inflation trend. Inflation is much lower now, but by looking at trends in sticky CPI prices (a kind of a core CPI concocted by the Atlanta Fed), I concluded that we might be at a turning point.

Notice how the series has fallen in both cases. In 2004 after turning to the upside it continued rising. If this were also the case from here on, short term rates would start rising more (or falling less) than long term rates, thus, the yield curve would start falling and the stock market would find itself mostly in the context prevailing at the beginning of 2004.

It seems that the current recovery got at this point late, but it it did, and this has bullish implications over the long term (several years). Over the intermediate term, however, the implications are bearish.

Friday, February 18, 2011

Time to Try the Short Side

Important economic data has been reported during the week. I will update the charts over the weekend.

Meanwhile, I think the short side can be tried again in the next days. The put/call ratio has finally spiked:

Also, the upside looks limited at least over the short term:


So, it is time again to sell rallies above yesterday's close. However, given that Monday the markets are closed, I think a better strategy is to wait until Tuesday. The market has the tendency to change course only after holidays even if it is ready to do it before.

The ST Trading bias becomes "short" again starting next week.

Thursday, February 17, 2011

Still Diverging

The divergence continues between the ratio and the market.


The put/call ratio is in general very volatile but with enough experience one can guess by and large what the market did just by looking at the ratio. It is not the case lately, however. The two are diverging again (green segments). I am saying "again" because the previous case was as recent as last week (red circles). In my experience, these divergences lead to a push higher by the market and at least a bullish spike in the ratio. This time may be no different and it supports my recent expectation of a move higher, around 1341 SPX, before another top attempt . The steep divergences in the cpc also lead bigger corrections.

Wednesday, February 16, 2011

Moving Higher

As I pointed out earlier in the week, the market is on its way to 1241 SPX. That is where it will make another attempt to top for the intermediate term.

The put/call ratio is supporting this scenario since the recent rise in the stock market has not led to any bigger bullish spike:

For the short term, the long side should be favored but I will refrain from trading given my expectation of a more important top.