Tuesday, August 31, 2010
Update
Cut My Long Position in Half at 1044.75 ES
Market Outlook
Monday, August 30, 2010
Market Outlook for Monday
Sunday, August 29, 2010
The 10 Point Mistake
On Friday I added to my long position before the 10 am report. Big mistake!
One of my most favored entries is fading the 10 am news report when the market is oversold or overbought. In the current case the market was oversold and I wanted to go long. The reversals after 10 am news are especially powerful when the news would confirm the trend that is about to reverse. Indeed on Friday the lower consumer sentiment number would have been consistent with more downside had the market not been ripe for a turnaround.
Still, this time I completely forgot about the 10 am report. As the market touched the 1050 support it seems I just entered a trance and skipped the upcoming Ben Bernanke speech or the Consumer Sentiment report. Had I not done that, I would have probably been able to add at 1040 ES. This means that my omission cost me 10 ES points. Two or three more of these and they sum up to a full standard loss.
Friday, August 27, 2010
A Glance at the GDP Revision
Looking in the Rear-view Mirror
Thursday, August 26, 2010
Ready to Go Long
Wednesday, August 25, 2010
Market Outlook
Trade Idea: Buy Oil

Tuesday, August 24, 2010
Downside Target
Monday, August 23, 2010
The Bullish Case: More Evidence
Friday, August 20, 2010
Long Half the Standard Size at 1069.25
Update
Contrarian Signal
Analogies
Thursday, August 19, 2010
Out of 50% of the Longs at 1078.25
Market Outlook: Rally Time!
 It seems that as the market moved higher, approaching 1100, the bears were confident enough to add to shorts. It does not get any better than this for the bulls. It is time to add to longs.
Wednesday, August 18, 2010
Market Outlook
Tuesday, August 17, 2010
Lines in the Sand
Monday, August 16, 2010
Added to Longs at 1068 ES
Trade Update
Saturday, August 14, 2010
The Retail Sales Conundrum
Friday, August 13, 2010
Trade Plan
Scenarios
I am using SPY charts because the intraday behavior is more evident.
Here is nowadays:
March-May 08:
The red box highlights the period most similar to what the market has been doing from the beginning of August 2010. There is an initial rally on the 1st of April, a period of distribution and then a correction with a big gap down and continuation on April the 11th (August the 11th nowadays). I circled in green the day where we are now. This analogy portends a rally to higher highs from these levels.
July-September 08:
Again there is an initial rally, a consolidation, a correction and a day after the big move down that would be yesterday’s correspondent (circled in green). A move up follows but no higher highs.
So, which one will it be this time? Is the market going to make higher highs?
Here’s an update on one of the indicators I introduced before. Note that it has reached the overbought level for bear markets (green circle) and it has fallen sharply. In the previous bear market after this kind of a fall the rally never made it to higher highs.
Thursday, August 12, 2010
Update
Getting Ready to Go Long
US Consumers Still Depressed
Wednesday, August 11, 2010
Wild Market
Tuesday, August 10, 2010
Quick Update
Expectations on Fed Behaviour: QE 2.0
Monday, August 9, 2010
Quick Market Update
Sunday, August 8, 2010
Trade Idea: Short US T-Notes
Friday, August 6, 2010
Quick Update
Looking for Strength into the FOMC Meeting
Thursday, August 5, 2010
Market Outlook
Wednesday, August 4, 2010
Out at 1119 ES
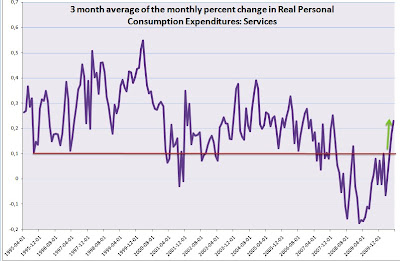
The Limping Foot: Services
 The series in the chart above is the 3 month moving average of the monthly percent change in Real Personal Expenditures on Services (click to enlarge).


