Thursday, April 18, 2013
April 18, 2013 - Covered short at 1541
The market still looks weak but it could start a bounce from the 50 DMA.


Thursday, April 11, 2013
April 11, 2013 - I got short at 1584.75
I had left a sell order overnight. The rally to new highs is weak and this bull leg should be over.
The market has already surged and settled above the 2007 high so the risk is minimal. I will hold on to this position even if the market does not sell off right away.
April 13 - Update: Everybody seems to be expecting a correction (see here and here). So, I think the market is close to a top but may reach 1600 on the S&P500 first. I will hold my position even if this happens, as I think the correction will reach at least the 1500 level.
Saturday, April 6, 2013
April 6, 2013 - slowdown confirmed, gold to bounce
The employment data that came on Friday generally confirms the slowdown I talked about in my previous post.
Here is a chart of a short term rate of change in employment. The series has further to fall.

From another point of view, this slowdown in employment may very well have marked the top for this recovery. Here is a yearly percent change in private payrolls (excluding health & education payrolls which are not cyclical).

The top is already in place from last year. In previous cases the series continued its fall.
During the previous bull it had topped in April 2006 and the market followed only more than a year after. This is why this bull market, even if quite old, has further to go.
Meanwhile, the price of gold has reached the bottom of a long trading range.

As I wrote in my previous post about gold, its price is rising in anticipation of economic weakness, and falls when the economy accelerates. I have anticipated the economic slowdown, but gold continued to fall. This may suggest further weakness this year.
But until then, gold is at important support and is a short term buy as it bounces during the correction in the stock market. Then, the time will come for another leg down as the correction on the monthly chart could be bigger than 20%.
Here is a chart of a short term rate of change in employment. The series has further to fall.

From another point of view, this slowdown in employment may very well have marked the top for this recovery. Here is a yearly percent change in private payrolls (excluding health & education payrolls which are not cyclical).

The top is already in place from last year. In previous cases the series continued its fall.
During the previous bull it had topped in April 2006 and the market followed only more than a year after. This is why this bull market, even if quite old, has further to go.
Meanwhile, the price of gold has reached the bottom of a long trading range.
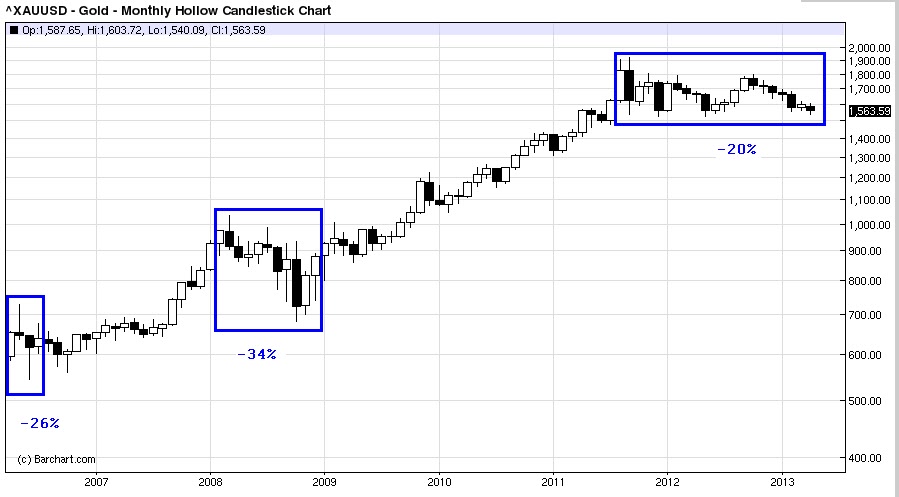
As I wrote in my previous post about gold, its price is rising in anticipation of economic weakness, and falls when the economy accelerates. I have anticipated the economic slowdown, but gold continued to fall. This may suggest further weakness this year.
But until then, gold is at important support and is a short term buy as it bounces during the correction in the stock market. Then, the time will come for another leg down as the correction on the monthly chart could be bigger than 20%.
Tuesday, April 2, 2013
April 2, 2013 - correction just around the corner
It's been a nice 18% run, but it's over. The market is up against strong resistance and the short term breadth is awful. Such a pessimist tone is not appropriate because the bull is not over, but, still, a 7-10% correction is just around the corner.

I drew resistance on the monthly chart above. There were many other important levels that did not manage to shake the market for more than a few days, but this is the ultimate level - the high from 2007. The market will most probably rise and close above this level and then turn lower in the following days.
Here is an indicator of breadth that shows important divergence - the 13d ema of TRIN.

The weakness of this indicator has been disregarded by the market in the recent past. In fact, I was expecting a larger correction based on this indicator in my previous post. The big difference now is that the market has already risen by 18% and it is making record highs.
There are also some economic indicators that are sensitive to intermediate term fluctuations in economic activity. These are quite correlated to the market and they are suggesting a slowdown.
Here is the 3 month average of the New Orders vs.Inventories ratio,

the US PMI, which has turned lower recently,

the pace of change in Retail Sales, also turned lower,

and the pace of change in Employment (private payrolls)

Over the long term the bull is still alive. Employment in the US has been doing constantly ok and this should fuel the expansion at least until the end of the year. Overseas, The Chinese PMI has started to rise strongly and even the European economy is at the beginning of an acceleration phase.
Here is the Business Cycle Clock from Eurostat, showing the European Economic Sentiment Index (ESI), an indicator that leads economic activity and even the markets.

Thus, a correction that stays within the parameters of a bull market is a buy. It will probably reach the 1420-50 zone, but this level is just a wild guess for now.
Monday, January 21, 2013
January 21, 2013 - long term strength, short term weakness
The bull market is showing good strength over the long term, but the short to intermediate term is not looking very good.
Here are two long term indicators that have reached new levels of strength for this bull and are breaking the pattern of multiple divergences associated with bull market tops.
> NYHL - 52 week new highs - lows

> the percentage of S&P 500 stocks above their respective 50 day moving average.

This suggests the bull may enter an acceleration phase, a fact also supported by the strength in employment and housing. These may have reached their peaks for the recovery, but no bull ends before these indicators have weakened for a while.
Here is a a rate of change in the unemployment rate and a housing market index.


Meanwhile, shorter term indicators are not so good looking. Breadth, as expressed by the 13 day EMA of TRIN, is clearly diverging with the market.

This kind of divergence signals a bigger correction with great precision, especially when the environment is favorable, as suggested by the record low VIX...

... or, by the slowing down pace of change in retail sales.

Usually. a more important correction comes after a significantt level of resistance is hit on the long term charts. Here is the monthly SPX.

The market has just broken above the previous highs, 1474 - a possible level. The next one to the upside is 1522 - a bit far, but not unreachable.
Which one is it? My guess is 1474, but it's only a guess. We'll get a first clue during the following days. The market has committed on the daily chart above the previous highs, so at least a small correction is in order. The market could tip its hand on this correction.
Here is the daily SPX.

Here are two long term indicators that have reached new levels of strength for this bull and are breaking the pattern of multiple divergences associated with bull market tops.
> NYHL - 52 week new highs - lows
> the percentage of S&P 500 stocks above their respective 50 day moving average.
This suggests the bull may enter an acceleration phase, a fact also supported by the strength in employment and housing. These may have reached their peaks for the recovery, but no bull ends before these indicators have weakened for a while.
Here is a a rate of change in the unemployment rate and a housing market index.
Meanwhile, shorter term indicators are not so good looking. Breadth, as expressed by the 13 day EMA of TRIN, is clearly diverging with the market.
This kind of divergence signals a bigger correction with great precision, especially when the environment is favorable, as suggested by the record low VIX...
Usually. a more important correction comes after a significantt level of resistance is hit on the long term charts. Here is the monthly SPX.
The market has just broken above the previous highs, 1474 - a possible level. The next one to the upside is 1522 - a bit far, but not unreachable.
Which one is it? My guess is 1474, but it's only a guess. We'll get a first clue during the following days. The market has committed on the daily chart above the previous highs, so at least a small correction is in order. The market could tip its hand on this correction.
Here is the daily SPX.
Friday, December 21, 2012
December 21, 2012 - buy gold
What drives the price of gold? Inflation and inflation expectations would respond most people interested. In fact, some are obsessed by more than inflation - hyperinflation is just around the corner and it is going to make the price of gold shoot through the roof! They cannot explain why gold has risen despite the rather deflationary environment since 2008, but they have made money and that's all that matters.
But there is another view, which is not known to many. Gold is priced just like bonds are. That means that gold is sensitive to the expected fluctuations of the real interest rate. Here are some blog post by Paul Krugman explaining this:
http://krugman.blogs.nytimes.com/2011/09/06/treasuries-tips-and-gold-wonkish/?smid=pl-share
http://krugman.blogs.nytimes.com/2011/09/10/golden-spikes/?smid=pl-share
http://krugman.blogs.nytimes.com/2012/08/26/golden-instability/?smid=pl-share
In short, what this means for gold now is that it should rise whenever the economy is expected to slowdown, because this would imply a lower real interest rate as long as the Fed keeps inflation expectations relatively high.
As I said in my previous post, a slowdown in the economy, and mostly in employment, can be anticipated starting in January. If retail sales continue lower, the direction will be confirmed. Meanwhile, Gold has come to a very nice, low-risk buy point - committing below its 200 DMA and hitting monthly support.

I think this point will represent the low for the multi-month correction in gold and that a move to new highs will start soon. Generally, gold is ending its corrections as the market approaches a bigger correction. With yesterday's developments regarding the fiscal negotiations, a more important top for the stock market may have been pulled closer.
Monday, December 17, 2012
December 17, 2012 - target 1522
The market seems to have tipped its hand since I last wrote. It has strengthened up after reaching intermediate term oversold levels, as shown in my previous post.
Here is a monthly chart of the SPX.

The bull market has a tendency to correct at long term resistance levels. The next one to the upside is 1522.
A move to this level would also represent a break out of a rising wedge - not uncommon for this chart pattern.
The economic picture has some points of weakness, but consumption, as a consequence of a continuing recovery in employment, is doing ok.

But this is a symptom of an ending recovery. Businesses have expanded their profits first, then they added equipment & software and then they started adding more workers, which led to higher consumption. Now, they are cutting back on investment and they will soon slow down on hiring. Here is a chart showing the correlation between capital expenditures and employment. Capex leads employment.

So, during the first half of 2013, employment reports will most probably get worse and worse. The market will ignore this for a while, since this means the Fed will stay easy, but the Wile E. Coyote moment will come, just in time for the upside break out of the wedge to fail, as it many times does.
Subscribe to:
Posts (Atom)