I do not like the fact that tomorrow the ECB will probably raise the interest rate but this is cancelled out by a depressed put/call ratio and the prospect of a strong NFP number on Friday.
Wednesday, July 6, 2011


Saturday, July 2, 2011
Weekly Wrap Up, June 27 - July 1st 2011
Economy: ISM New Orders vs Inventories ratio suggests future economic strength.

The ratio above is at levels from where it usually starts to go up, meaning that in the near future businesses will be faced with increased new orders compared to their inventories. This means rising capital expenditures, employment and inventories, in other words, increased economic growth.
S&P500: Strong week pointing higher.

Last week market action was very strong. As seen in the chart above, previous such strong weekly candles coming after greater than 7% corrections led to more upside.
Generally, strong bull legs are followed by weaker ones (purple arrows). In 2010 the market went up 17% after the 32% rise in 2009. Now, after the 30% rise from September 2010, a 15% rise would put the market at 1446.

Breadth was strong: in just one week there were 2 consecutive days with greater than 80% up volume and one day with greater than 90% up volume.
One Week, One Stock: First Solar, Inc. (FSLR) - looking bad
Sales growth is expected to slowdown a lot in FY 2012 ...

... while operating margins are dropping fast on a yearly and quarterly basis ...

... and EPS estimates are revised down

However, the market already knows it and the stock is down ...

... so it may get close to a buy point as soon as the problems with operating margins go away.
Looking Forward
Two major events next week:
> European Central Bank meeting: a rate hike is in the cards. Corrections of about 1% or to the 1.44 zone, before the announcement, are buying opportunities for EURUSD.
> US Employment Report: My current view is that the market will anticipate a strong number since other indicators for June were strong. I will buy SPX on pull-backs before the announcement.
Ideas
Time the intraday market swings by fading spikes in the put/call ratio (detailed post here)

Friday, July 1, 2011
No Spike, No Short
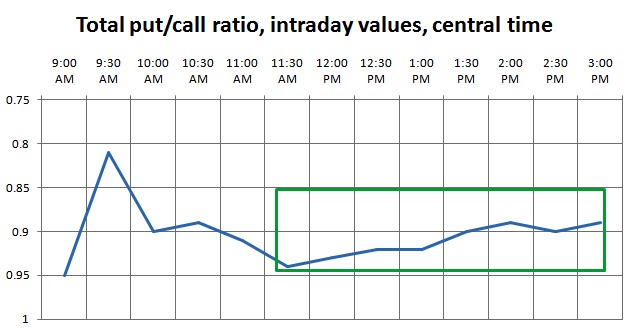 The market went up after lunch but the ratio din not spike at all. This kept me from going short again. The intraday behavior of the ratio kept me out of trouble today, when the market just went through the roof.
If my analysis of the ratio is correct, too many shorts (myself included) entered after the big move up on the ISM number, thinking the market cannot go much higher. Since the ratio did not spike as the market kept rising, I am assuming many shorts are keeping their positions, which may induce a further rally early on Tuesday.
Using the CPC for Intraday Timing
Here is an example of how I used the intraday readings of the total put/call ratio to time my entry and exit today.
In the chart below, SPX is represented by 30 minute candles and the CPC (put/call ratio) by the blue line. The cpc values are provided at the end of each half an hour by the CBOE.

My longer term analysis suggested the market could correct today, so the question was where to short. Generally, I believe fading extremes in sentiment offers the best entries, so I thought that extremes in intraday sentiment would be quantified by bigger spikes in the cpc values. I was looking for spikes bigger than 0.1 in the ratio to qualify as extremes.
The first extreme, in bullish sentiment, came at the end of the first hour of trading (second 30 minutes bar). The ratio had spiked from 0.95 to 0.81, so a short entry was granted (in fact I had entered short earlier as the market shot up higher - posted on the blog -, but I was close enough to the ideal case). This short entry is marked by the red circle.
However, after 30 minutes, at 11:00 am, I noticed the ratio had spiked down (on the inverted chart), first green arrow. This qualified as a bearish extreme in sentiment and it was surprising to me because the market had barely dropped. So, I chose to close half of myshort (not posted on the blog), marked by the green circle.
When, at 12:00, despite the rising market the put/call ratio continued lower (on the inverted chart), second green arrow, I decided it was time to close the rest of my position (posted on the blog), second green circle, expecting the market to move higher on the back of the rising bearish sentiment.
At the moment, I am waiting for the next "bullish spike" on which I would try a second short entry for a steep drop into the close.
Out at 1327.5
The market will probably move down after lunch time but, for now, it looks ready to head higher.
The No Pullback Rally
The market has risen for four days in a row, each time closing strong, at its highs. I looked back into this and previous bull market and found some similar cases. My requirements were a strong move up after a bigger correction, multiday rally with very small intraday corrections.
I found that corrections, when they come, are not larger than 10-15 SPX points. Also, the market keeps going up relentlessly, many times to new highs. As the rally gets longer, there are some corrections of 20-25 SPX points, but nothing more.
Here are the instances I looked at:
> March - April 2011, September 2010, December 2010, July 2009, September 2009, May 2005, Oct-Nov 2004 <
Here is Oct-Nov 2004:

To sum up, a 10 points correction would be a benediction at these levels. I think we will get it today. If it comes early, I will try to buy it, if it comes after lunch time, I will wait until Tuesday.
Subscribe to:
Posts (Atom)