Thursday, March 29, 2012

No more evidence against an intermediate term top

The market is at resistance on the monthly chart and it is showing weakness.


By weakness I mean, for example, that despite the strong rise on Monday only about 85% of the volume was on the upside, or that the 13 day ema of TRIN is showing clear weakness.


There are also all sorts of divergences with other indicators like the 52 week New Highs - Lows or the percentage of stock above their 50 day moving averages.

Taken separately, these would not mean much but when the market is at big resistance and it is selling off like it did yesterday chances are we are at an intermediate tern top.

A good way to take trading decisions is to look for evidence that would invalidate a certain scenario.

Until now, the IT top scenario was strongly invalidated by a strong TRIN. This is not the case anymore and I have to dismiss my initial expectation of  a move to 1450 SPX.


Wednesday, March 28, 2012

Out at 1395.5

The market has crashed through 1400. I think it will be weak until the close

Long at 1401.25

Covered long at 1409.25

Given the weak close yesterday, I expect a drop close to 1400 before another move to new highs.

Tuesday, March 27, 2012

The dollar

Here is the monetary policy guidance given recently by the ECB and the Fed:

> the ECB: 

"Owing to rises in energy prices and indirect taxes, inflation rates are now likely to stay above 2% in 2012, with upside risks prevailing".


> the Fed, through Ben Bernanke:

 "[...] the Federal Reserve's accommodative monetary policies, by providing support for demand and for the recovery, should help, over time, to reduce long-term unemployment as well."


I think the ECB is mistaking the rear-view mirror for the windshield, again. And the market is starting to react. 


Here is a monthly chart of the US Dollar June contract:


The dollar has been sold at the 81 resistance. It has support below 78.

This can be also seen on a weekly chart:


While on the daily chart a head and shoulders with break-down projects to 78:


Monday, March 26, 2012

Update

The market hit daily resistance at 1405.75 and, since, has traded in what I consider to be a weak manner.

Because I bought quite high, I would want to see the market trending up and close strong. Thus, I will exit if the rise after 1 p.m. is faded.

Long at 1401.5

The correction is over

The short term TRIN indicator is back into the buy zone, while the market gaps up after being bought on Friday. 
This means that the correction on the ES daily chart has only been 27 points long despite the market hitting monthly resistance or being up 22% since November. 

I think the most pessimistic scenario right now is a range here between 1380-1410 followed by a rise to 1450.

I will be looking for an opportunity to buy this week and hold until the employment report next Friday.


Friday, March 23, 2012

Waiting ...

The market is short term oversold.


But the correction seems too small to have already ended. 

This is why I am not buying yet

Also, the short term TRIN has spiked to a level that suggests weakness.


Generally, the market may drop further when this indicator goes beyond the 1.4-1.5 level on corrections.


Tuesday, March 20, 2012

Covered short at 1394.5

I think the market may rise again towards yesterday's highs before dropping further.

Monday, March 19, 2012

Update

The market is still drifting higher. I think it will top out today after 1p.m. or tomorrow.

This is why there is no point is closing my short now, as I could be exiting right before the drop.

Short at 1400.5

Short term trade for a move to 1385 ES

Overbought and at resistance

The 13 day ema of TRIN has spiked on the recent rally suggesting the intermediate term rally is not over. However, the indicator is overbought. Chart:


Meanwhile, the SPX has reached monthly resistance, from where a correction of 30-40 points  might start.

After a dip that might resemble the ones in the summer-autumn of 2009, I think the market will start rising towards 1450.


Wednesday, March 14, 2012

Oil

Here is a link to a post I wrote in 2010, whee  I showed that whenever the pace of change in CPI turned upwards from low levels, oil represented a good investment.

Recently, CPI turned as mentioned above.


The weekly chart of the April oil contract shows that there is already an uptrend and that the market is consolidating above the 105 support level.. This is no wonder with a strengthening economy and the current geopolitical tensions.

The next resistance to the upside is around 113.

On the daily chart there is a triangle that may be forming. The market may head down to 104 before breaking out to the upside.


Tuesday, March 13, 2012

A long term view

The market has deceived me into not buying yesterday. I also expected a drop before the FOMC announcement but it looks like it won't happen.

The way the daily chart has rallied to new highs without any pull back after the fast drop last week reminds me of the summer-autumn of 2009.

Here is a chart of the December 2009 ES contract.

Back then, the market would rise straight up to new highs only to correct again deeply below the previous high. If this is the case now, we are in for a roller-coaster ride.


While waiting for the next pull-back here is a long term perspective.

On the monthly chart below I have drawn past resistance levels but also the ones that lie ahead, as this is where an intermediate term top (a top which precedes a 7-10% correction) may take place.

S&P500 monthly chart

The green arrows show a possible road map. This bull leg will encounter strong resistance at 1450 from where a 7% correction would bring the market back to 1350.

A move to 1450 would make the rally that started in November 25% long - nothing out of the ordinary.

A stop along the way will probably be just above the 1400 level, where there is also some resistance.

Monday, March 12, 2012

Update

The market is weak before the lunch. It also seems not to hold the daily support at 1362.25 (June contract).

This suggests short term weakness and I canceled my plans to buy at 1360. I think the least risky entry is on drop tomorrow, maybe after the FOMC announcement.

Looking to go long

A brief recap: the daily chart has corrected about 40 points, more than I had initially expected, then the market started rising three trading days ago into the employment report which came in strong. There is a FOMC announcement tomorrow and I anticipated a small drop until then since there are expectations of some hawkish comments.

Here is a daily chart of the June contract.


My intention is to take advantage of this small correction and go long for a move to 1400. I expect such a move because the economy still has room to accelerate, the 5 day ema of the put/call ratio is still depressed and the breadth is solid on the rebound until Friday.


The plan sounds good but the market has to agree too.

If, initially, I was looking for a 15 - 20 point drop to enter on, now the market looks tight so that I am ready to buy even only a 10 point correction today or tomorrow - only if conditions seem right.

Here is a short term (3 hours) Globex ES June contract. I have highlighted my preferred level to go long - around 1360.

June ES 3 hours chart

Saturday, March 10, 2012

Strong NFP report

I showed the chart below in the past and I commented that the pace of change in US private payrolls stabilized at a level consisted with expansions. Here is an updated chart - nothing is changed.


There are good chances that payrolls expand at a similar (or slightly lower) pace in the near future.

The acceleration of some economic indicators I was talking about here has very good chances of taking place and this bodes well for the whole economy and the stock market.

The intermediary term bull leg will, thus, reach higher levels. My guess is that the first stop on the daily chart is the 1400 level on the SPX. As I will show in a future post, technicals do not stand in the way of such a move.

Thursday, March 8, 2012

Covered longs at 1367.5

Reasons for that:

- the market has reached strong resistance on the daily chart at 1368-69;

- after dropping fast the market does not rally straight up to new highs;

- expectations are high for the NFP report and the market will probably be deceived;

- the Fed has had a hawkish aura lately and this may attract some short term sellers until early next week.

Added to long at 1359.5

Wednesday, March 7, 2012

Long at 1350

This is what a poker player would call a feeler bet - small position to get a feel of the action from the inside.

I will dump the trade if the close is weak.

Is it end-January 2011 all over again?

Here is what happened back then:


And here is what happens now:


Will the market act the same? With a still depressed put/call 5 day ema and good expectations for Friday's NFP report, I wouldn't be surprised if it does.

Waiting

I did not manage to get the best exit yesterday. If I had waited until today I would have gotten a much better price. 

However, this is hindsight. Given the strong downward momentum and the lack of vigor until the last 10 minutes of the session, I am content with my decision to exit at 1340.5. 

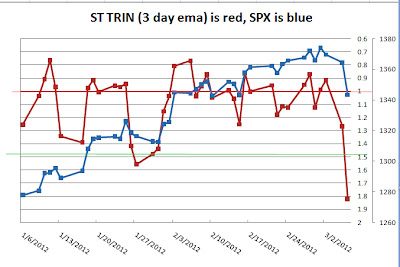
Now the question is whether to still play the long side or not after this correction. For an answer, here is a timing indicator I use, the 3 day ema of TRIN.

Generally, it is safe to buy the daily chart as long as the indicator stays above ( the scale is inverted above) the 1,4 -1.5 zone. 

At the moment the indicator is much too weak, suggesting that I should wait until it turns back above the mentioned zone. This usually keeps me from buying too early into a correction that has not ended.

Tuesday, March 6, 2012

Out at 1340.5

I was hoping for something above 1342 but the market is dull and the session ends soon.

Second update

The market has clearly shown weakness until now and the downward momentum is especially strong for the uptrend that started in January. Since there has not been any larger intraday pullback to exit on, I am keeping my longs for a bigger bounce.

The market is very close to the weekly support at 1335, so the downside risk is not so great especially since I have taken only a partial position.

Update

Certainly, I entered too early but the daily correction might be over at 1343 and I am keeping my long.

I will add to this tomorrow if the market shows some strength. I will only exit my position if there is more weakness today (like a weak lunch entry, or new lows after the lunch).

Long at 1351.5

Leaning on the 1350.25 support.

It's here

The market has already come to the 1350 support zone I talked about previously.

As I showed in the previous post I had reasons to believe this correction would stop here. These reasons are still valid.

My buying tactics: since today we might see a trend day down, I will enter about half of my desired position on weakness below 1353 at the open and add the other half tomorrow if the trade idea is still valid.


Update: another reason to believe the market stops falling today or tomorrow is the coming NFP report. Expectations will be high given the previous strong report and, usually, the market tries to anticipate a few days in advance.

Thursday, March 1, 2012

Evidence against a bigger correction

I said before that I expected a correction of about 40 points and, given yesterday's action, it might have already started.

Still, there is some strong evidence against it for now.

I am talking about the 5 day ema of the total put/call ratio, which hasn't spiked despite the relentless rise up to 1380.


I checked back into the history of the bull since 2009 and I could not find another similar instance that would lead to a greater correction except for intermediary term tops, a scenario that is ruled out for now.

The second piece of evidence against a greater correction is the way the daily chart looks. It has not had a period of acceleration into the top, which usually precedes greater corrections.

ES March contract daily chart starting in January
I have also marked two support levels that would contain this correction: 1350 and 1335. At the moment, I think 1350 will hold.