Tuesday, November 30, 2010
Update
My stop loss is at 1170. If that price is hit I will be out even if I do not post in real time.
Recovery to Continue, Says Europe
The chart below shows the European Consumer Confidence Index (blue) and the European Index of Major Purchases (red), an index that I constructed myself using data related to major purchases in the European Sentiment Index report.

I previously analyzed the European Consumer Confidence Index (ECC) here, and concluded that a turn to the downside in the index is usually a signal of a top in the stock market and a slowing economy. I also said the the event which would invalidate this scenario was the index making a new high, in which case, according to previous similar contexts, the economic recovery would continue..
That is exactly what happened in November, with a reading above the previous high in August (green circle). Reinforcing the indication of a continuing recovery is the European Index of Major Purchases which has been strong recently (black circle).
Monday, November 29, 2010
Long Again at 1182.75
The market made me get out earlier in the day. Now it is finally rallying. Typical behavior.
Out @ 1174.75
Sold my entire position. The rally looks weak. I will reassess and try again, most probably tomorrow.
Trade Plan
Today the market looks great for a long entry. No, I am not watching the charts upside down. I know the futures are down significantly. Here is why I like the way the market is positioned:
- It has sold off already. If it really turns today it probably is close to the lows.
- If it continues lower, it does not have to go too far to convince me to take my losses. This allows me to enter using a larger position than usual.
- Most of the bulls are probably shaken out or sitting on the sidelines.
For entry levels, I will adapt depending on the open but here are some areas of interest:
> around 1183 - the electronic lows from late last week;
> around 1180 - the overnight lows (until now);
> around 1175 - previous important lows.
I will enter as soon as the market falls into one of these areas.
As for stops, I will take my losses if 1174 is breached decisively but will also do some scale outs above this level if the market looks reluctant to rally.
Friday, November 26, 2010
Analogy
Today marks exactly one year since the sovereign debt trouble in Dubai has come to the attention of the media. The markets seem to celebrate the same way as they did then.
Here is how the SPX looked by the end of Monday after the Thanksgiving back then:

I also remember the put/call ratio being overextended into oversold territory as it will probably be at the close today.
This analogy reinforces my view that Monday will be a good time to buy for a move up until the end of the year.
Wednesday, November 24, 2010
Update
I bought some longs at 1193.5 but I am refraining from entering the bulk of my position this high since there is a holiday ahead of us and the markets are closed.
I expect to get a better chance to add to my longs on Monday. Here is how I think the following two trading days will roughly unfold, with the big green candle representing today:

The intraday reading of the put/call ratio (courtesy of StockCharts.com) points to increased bearishness even after today's rally:

Ready to Go Long
The market is oversold judging by the put/call ratio:

It has also showed strength yesterday by not making new lows after the lunch.
Since I think the economy will continue expanding and we are still in a bull market, it is time to buy for a move to new highs. I would have preferred to get this buy signal next week but, since it came, I have to act on it. I expect next week to offer another opportunity to buy and I will probably add to my longs then. My target is 1250.
As for levels to buy at, I like the low of the overnight range until now, approximately 1175 ES. However, I do not know if the market will go there and I am ready to start going long after pull-backs of about 5 points (it is a round number). I intend to build a large long position in the 1170-1190 area until the employment report is released next Friday.
Tuesday, November 23, 2010
Market Outlook
Today the market will try to sell off again. I think it is the last chance this week since tomorrow and Friday will probably trade with an upside bias due to Thanksgiving Day.
Meanwhile, the put/call ratio has not spiked enough to warrant a long entry:

I expect it to give a buy signal by the end of next week, around Friday's employment report. I would especially like a signal to buy before the report since I think it will come in strong.
Monday, November 22, 2010
Market Outlook
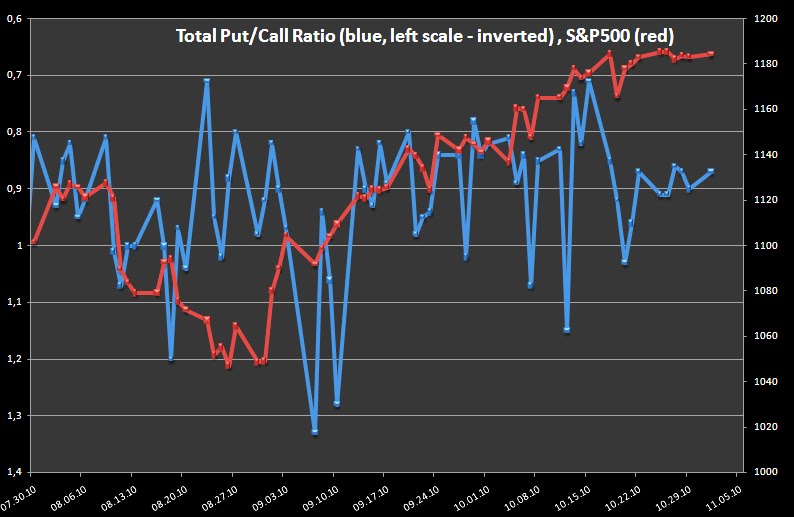
The market is ready to fall again at least to the recent lows at 1170. Here is the put/call ratio indicating an overbought condition:

The ratio reaching above previous overbought levels indicates that many traders have become too bullish with the recent good economic data and the prospects of an end-of-the-year rally. I expect them to be shaken out during the week ahead.
Sunday, November 21, 2010
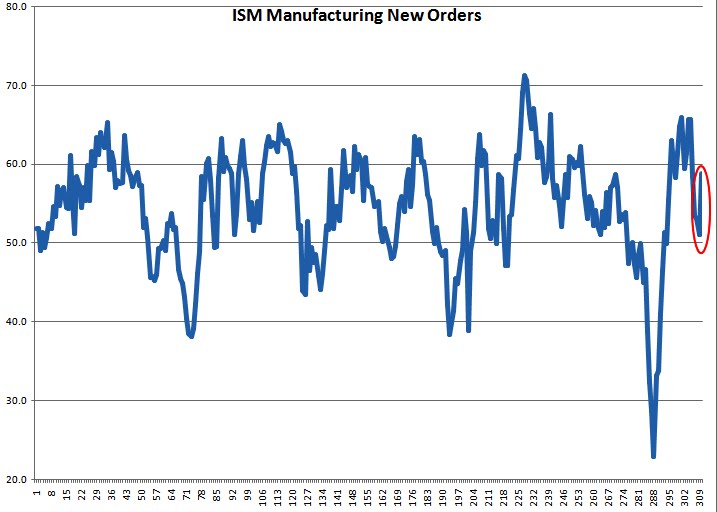
Industrial Production at "Support"
Here is a chart of a series describing the average pace of change in US Industrial Production:

I have drawn some important levels, from which the series has turned in the past. Currently it is at the blue horizontal line after a slowdown which is not uncommon during economic expansions. I expect the series to turn back up and rise toward the upper black line.
This expectation is reinforced by the lagged correlation that exists between Industrial Production and the New Orders component of the ISM Manufacturing index. Notice how the New Orders index has sharply turned up also from what looks like a support level around 50:
Friday, November 19, 2010
Weak Rally
Yesterday looked very strong around lunch time: huge gap up with follow through. This market action on top of retail sales good news made me start buying just in case I missed the bottom.
Usually, on big trend days there is a pause during lunch and then a continuation but only after a shake out. The shake out happened after 2pm around the 1196 level and I went long. However, the market failed to make new highs although it tried. I interpret this as a major indication of weakness.
After the close I noticed two other signs of weakness:
- yesterday was not a 90% volume up day (it was just 88%);
- the consumer discretionary sector etf (XLY) underperformed the more defensive consumer staples etf (XLP):

Each of these weaknesses taken separately don't mean much but when taken together suggest this rally will fail.
I will wait for the market to become oversold again before another attempt at going long.
Thursday, November 18, 2010
Retail Sales Strength Continues
Quick post.
The economy will continue expanding. The recession is postponed. Here is the updated real retail sales series I analyzed previously:

Since the series has reached above 0.5, I think the pace of change in retail sales is healthy enough for the expansion to continue.
Wednesday, November 17, 2010
Market Outlook
 With all the downside yesterday, the put/call ratio is still outside of the oversold area. This makes me think we will see lower lows before a significant rally.
 Using the Fibonacci retracements I came up with a target of 1167 on the SPX:

It is quite ironic that the twin rallies in 2010 be derailed by the same Euro crisis. For now, my outlook is still based on an end of the year rally to new highs starting somewhere end-November or early-December, but I am well aware that the Euro crisis can be the catalyst for something worse.
Tuesday, November 16, 2010
Out @ 1182.5
The initial bottom looked very good but it failed which leads me to expect a trend day down.
Still Looking to Buy
I still think the market is ready to rally for a few days. Looking at the put/call ratio, I think there were too many bulls agreeing that it was time to buy yesterday since the ratio spiked big time and closed that way:

These bulls will be shaken out today and the path will be clear for a rally. Luckily, I did not join the bullish crowd yesterday as the market seemed too expensive above 1191.
But I am ready to go long today. Depending on where the market opens, I will either buy earlier (after an initial sell off) or after the lunch. A level that looks good is 1186 ES, just under the overnight low (until now, at least).
Monday, November 15, 2010
Ready to Go Long
The put/call ratio has spiked nicely indicating prevailing bearishness at Friday's close:

Still, the market did not make new lows after the lunch on Friday, a positive development.
Since we are in an uptrend and the ratio is currently oversold considering recent previous cases, I think a buy signal has been given. I am ready to go long today after some initial weakness. My preferred entry is on marginal new lows, around 1091 ES. The Retail Sales report may change all that and I will try to adapt.
I think the market is going to rally for the next few days. I do not know whether it will succeed to reach new highs or not but we are in an uptrend and I do not want to be left behind.
One of my indications to take eventual profits will be the 5 day ema of the put/call ratio reaching the red horizontal line again:

Sunday, November 14, 2010
Something Is Rotten in the State of (Denmark) China
Media exuberance over China continues unabated,

while the Chinese economy flounders.

Leading Indicators for China
Luckily, the US is around:

Leading Indicators for USA
The unknown unknowns are the most dangerous and China is becoming one. 2011 should be fun to trade!
Friday, November 12, 2010
Market Outlook
The futures sold off hard before the European open. However the European traders are trying to take advantage of the discounted prices and have bid the markets higher.
Meanwhile, the put/call ratio is still close to overbought, suggesting it is not the time to buy for a move to higher highs:

Until I see a reading close to 1 for the ratio, I expect the markets to head lower. However, I would not be surprised by a market attempt to rally from here, as it has already corrected about 25 SPX points, the average correction since September.
Thursday, November 11, 2010
Timing the Correction
One of my main timing tools is the 5 day EMA of the put/call ratio. Unlike the simple put/call ratio, it is most useful for the intermediate term time frame. Here is a chart from the beginning of the bull market in March 2009:

5 day put/call EMA is black, SPX is purple
I drew horizontal lines that represent overbought and oversold levels since March 2009. They are different in bull and bear markets. The big drop (the scale is inverted) in the black series in June 2010 reached a level associated with oversold conditions only in bear markets (other instances not shown on this chart).
Since the EMA has reached the red horizontal line, a correction for the SPX is in order. During the recent bull this worked with accuracy.
For tactical moves, I use the simple put/call ratio:

I said yesterday that I expected the ratio to spike up and then start falling again along with the market. The spike has occurred. For the ones looking to go short, today would be a great time. However, the market is already down as I am writing this and today is Veterans' Day. This is why waiting for tomorrow would be tactically better in my opinion.
In order to go short I would like to see the market closer to 1220. Nevertheless, even if I sell, I will use small size since timing tops in a bull leg is more like a guessing game.
Wednesday, November 10, 2010
Outlook for Wednesday
Yesterday the market showed a first sign of weakness by selling off during the last hour of trading. Also, the put/call ratio has started to decline on my inverted chart:

However, I expect the ratio to spike up again before more significant downside action for the SPX. The green lines describe my expected path for the cpc.The spike up could happen today with the market attempting to climb back towards the recent highs at 1220.
Tuesday, November 9, 2010
Outlook On Oil
I previously suggested buying oil was a good trade idea here. Given my new stance on the stock market, I still think it is. Here is a daily chart for the December contract, January 2010 - today:

The recent rally in oil reached an upside target obtained using the Fibonacci retracement levels. It will probably correct from here (red segment) along with the stock market and then start rising again. The next target on the upside is 92.
Monday, November 8, 2010
Market Outlook
The put/call ratio is still indicating an overbought condition:

Usually, before a temporary top, the ratio falls from its overbought level, then spikes back up again and only then the market starts heading down. This suggests some sideways action first during the next 2-3 days for the SPX.
I also noticed that the ratio is overbought at gradual higher levels, typical of a bull leg. Also, one of my intermediate term indicators has reached across normal bear market overbought levels. The 5 day ema of the put/call ratio:

Friday, November 5, 2010
Sell the Employment Report
Here is a December 2009 study by Bespoke Investment Group that suggests the market is a good sell after an initial gap up following a much stronger than expected employment report:
Given that the market is ready for a top as shown in my previous post, I am ready to sell around 1226 ES for a quick profit.
The Bear Is Dead! Long Live the Bull!
After yesterday's action and taking into consideration how the market traded since the beginning of September, I am dumping my bear market assumption. I now think the bull from early 2009 will extend. The bear will hibernate until at least late 2011.
Here is why I see yesterday as a very strong day:

source: Ticker Sense
Notice how risk led the market to new highs. Defensive sectors were laggards.
The spring - summer sell off reached bear market readings. Every time it did that in the past a bear market had begun. This time was different and I am satisfied I did not lose money even if I was wrong. In fact my account is up from the beginning of the rally. Some other bears have become hysterical.
Even if I think the bull will extend, I am not ready to buy. The market has risen about 20% already, the average length of previous bull market rallies. Also, from the point of view of breadth, this move up is visibly weaker than previous ones during the bull market (black segments):

More, the put/call ratio is overbought and is indicating a short term top is very close:

Even more, the employment report is due today and it usually corresponds to market inflection points.
So I think a correction is in the cards beginning next week. I expect it to be about 4-5% in length. The market will then start a move towards 1300 in late November - early December.
Thursday, November 4, 2010
The Boat Is Full of Skeptics. Will It Sink?
I previously said I would watch markets closely after the Fed announcement to determine the validity of my bear market assumption. Here are my two findings until now:
- Skepticism regarding the economy and especially the QE is very high. I have not seen any opinion out there that this move would help the economy, which is very surprising after a sustained rally.. From a contrarian point of view this is just fuel for the continuation of the upmove.
- The markets are not showing weakness. Europe is trading higher on record volumes, led by banks, the dollar is lower, oil is rallying and the ES broke 1200.
I will not draw any conclusions yet from these observations but implications are evident.
Market strength makes me reconsider my expectation of a sharp correction that would end by Friday. I think there are still stubborn bears that are stuck short. As soon as they bail out, which will probably happen today, the market can start a correction. I expect the put/call ratio to indicate this fact by a spike to about 0.8:

This would correspond to a top associated with the employment report tomorrow, an usual occurrence.
The correction will provide another round of information. Lack of weakness would lead me to believe the bear is dead.
Wednesday, November 3, 2010
Update
I did not sell. The market hasn't reached at least 1200. Although the top can be lower than 1200, it is risky to hold short positions overnight when the market closes near its highs.
The amount of the future treasuries purchases is not too big. It is just above $500 billion, a number anticipated before the announcement, meaning that it is already priced in.
Sell After the Fed
Today is the big day when the markets finally get to taste the carrot that has been in front of them for the last 2 months.
The put/call ratio is nicely set up for a top:

I think a good opportunity to sell will emerge on a rally after the Fed announcement. Resistance levels from early May are at 1200 and 1205 SPX. I like the latter.
I expect a steep correction, about 40 points in length. The big question is if this is the top of the bear market rally. I think it is not. There is going to be another rally attempt after this correction that can reach higher highs, but not much higher than 1200-1205, say 1211:

I will closely monitor the market during these two moves and expect to see weakness.
Tuesday, November 2, 2010
Market Outlook
The SPX sold off from the 1196 level for the second time on better than expected economic data. First there was the Existing Home Sales data last Monday and then the ISM data yesterday. This portends at least a short term top to come.
The ratio will probably set up for a top by tomorrow:
Also supporting my bearish views, I noticed bullish titles popping in the financial media during the last few days. This is a big change compared to just about a week ago when bearish sentiment was still rampant.
I expect a steep but short correction to start tomorrow or Thursday. I think the market will attempt to rally again next week.
Subscribe to:
Posts (Atom)