Tuesday, August 31, 2010

Update

I see no case for the short side yet but since today's expected rally was cut short by weakness after the lunch (this is the worst kind of weakness in my experience - when you are long, of course) I have to play defense and wait for more confirmation of my views.

Update to update (written after the close): What do you do when the worst kind of weakness is matched by the best kind of strength? Answer: Scale back in.

I am back to holding half of the initial long. Tomorrow should be strong. 1044 is the line in the sand as the market quickly reversed from below it several times.

P.S.: Sorry for the multiple updates on my trades but this is how I manage risk. I have to think of a more organized method of reporting them.

Cut My Long Position in Half at 1044.75 ES

Will sell the rest if we trade below the low of the day.

Update: sold another quarter of my initial long at 1044.5

Market Outlook

Yesterday's meltdown seems menacing but it is not uncommon market behavior during bottoming activity. Everything pointing to an important low is still there. For example here are two measures of breadth for the last few days:

- new 52 week highs - lows:

source: Stockcharts.com

- XLY vs. XLP ratio:

source: Stockcharts.com

On the economic front, yesterday's personal consumption report was not a weak one. The strength in services consumption is becoming more evident even if it may have reached the height of its normal interval of variation:

In conclusion, even if the market is close to a make-or-break situation (if it does not rally today more weakness will probably follow), I still think an important low is forming at these levels. This is why I will try not to be the yo-yo at the end of the market's string (Carl Futia's coinage) and cover on marginal new lows immediately after the open.

Monday, August 30, 2010

Market Outlook for Monday

I expect oscillation to be the main theme of Monday's trading session given that on Friday we had a big trending up move. Here is a 30 minute chart of the September contract with support/resistance levels:

On a day like this both sides of the market can be played. Depending on where it opens, the session can have a low at 1060 or 1055 (marked with green) and will most probably top at 1068 (marked with red) or 1072. The overnight range also usually plays an important role.

In conclusion, the important thing to remember today is not to get sucked in by a violent rally or sell off as these have a very high probability of failing.

Sunday, August 29, 2010

The 10 Point Mistake

On Friday I added to my long position before the 10 am report. Big mistake!

One of my most favored entries is fading the 10 am news report when the market is oversold or overbought. In the current case the market was oversold and I wanted to go long. The reversals after 10 am news are especially powerful when the news would confirm the trend that is about to reverse. Indeed on Friday the lower consumer sentiment number would have been consistent with more downside had the market not been ripe for a turnaround.

Still, this time I completely forgot about the 10 am report. As the market touched the 1050 support it seems I just entered a trance and skipped the upcoming Ben Bernanke speech or the Consumer Sentiment report. Had I not done that, I would have probably been able to add at 1040 ES. This means that my omission cost me 10 ES points. Two or three more of these and they sum up to a full standard loss.

Friday, August 27, 2010

Added to Longs at 1050 ES

A Glance at the GDP Revision

The headline number is lower but the positive developments from the initial release are still there. I acknowledged these here and here.

The revision was downward because the imports contribution (which subtracts from the headline number) was bigger and because the contribution of inventories was smaller. These two are not outright negative developments.

On the other hand the personal consumption of services added almost double the initial release amount, which is a clear positive.

In short, this is not a report to sell. If the market does not rally today or early next week, it is headed below 1000.

Looking in the Rear-view Mirror

Here is spx action at three recent important lows:

- late July:
- early July:
- early June:

The initial move off the lows is followed by a sell off next day and a gap up on the third day. This is one of the reasons I bought yesterday, one hour before the close. Some may find this method trivial but I would not exchange it for any indicator out there!

I only bought half of a full position because the GDP revision adds some uncertainty. By the way, the consensus of 1,3% seems too low to me. We might get a positive surprise leading to a gap up.

Thursday, August 26, 2010

Long Half of Standard Position at 1044.75 ES

Ready to Go Long

Yesterday, for the third time in 2 days, the market rose after bad economic data. The durable goods report was especially negative. This behaviour is a sign that at the current levels the previous negative economic surprises are fully discounted. There is one more important report, the GDP revision on Friday, that I think is going to attract sellers but any weakness should be bought. I also think the low for this leg down is in at 1040.

The put/call ratio has risen (fallen on my chart) enough to suggest going long:


I expect the market to trade up to at least 1120 in the following weeks.

Wednesday, August 25, 2010

Market Outlook

The fact that yesterday the market has rallied immediately after plunging on very disappointing home sales data is a bullish development and it makes me think the spx has started the process of carving a bottom. However, I still expect sellers to have the upper hand until the GDP revision is released on Friday.

The put call ratio has started setting up for an oversold condition but it is not there yet:


Trade Idea: Buy Oil

I have shown the chart bellow (click to enlarge) before, stating that it suggested benign inflation data in the near future. I also said I expected an uptick in economic activity as per this chart. These two developments are bullish for the price of oil.

Since the series has recently turned (black circle), I looked at what happened in the past to the price of oil after a turn from this level.

There were 4 previous similar cases. The turn in the series could be seen around the middle of the following months: February 02, August 03, February 06, January 07 (circled in green in the chart). Here is the continuous futures contract for crude oil in these 4 cases:

feb 02:

aug 03:

feb 06:
jan07:


This portends strength to follow for the price of crude. However, the context in the presented previous cases was a little different: economic expansion. Since this time around I expect the expansion to be cut short I would not bet on new highs for crude but I think it can reach the $83 level during the next couple of months.

This trade idea would be invalidated by a move down from here in the series for CPI.

Tuesday, August 24, 2010

Downside Target

The put/call ratio has been doing a good job keeping me from going long on Monday. Indeed there was no important "bearish spike". Also, while the market has been moving lower, the ratio has reached levels more consistent with an end of a multi-day move up:

Since I am still expecting an important move up to accompany a bounce in economic activity and there is no sign of a bottom yet, I will continue to stay out.

The chart below is a 30min spx chart for the June - today period:

The red boxes highlight previous continuous down moves. They all have been about 60-70 points in length. This would put spx at 1040 before we can see some significant upside

Monday, August 23, 2010

The Bullish Case: More Evidence

I previously stated I was expecting weakness for treasuries prices as the stock market was supposed to rally and the economy was lined up for a little bounce. The stock market hasn't rallied and t-notes were mostly up and in a range. Here is a chart of the September contract for the 10 year t-note:


Since I still believe we are in for a bounce in the economy I will interpret this range as distribution before a correction. I have highlighted similar previous cases by the red segments. This would suggest a rally in the stock market also.

The action on Friday is adding to the bearish case for treasuries. As the stock market was making new lows, the treasuries were sitting in a small range (green box below). Then as the stock market started a small rally, the treasuries sold off hard (red segment), approaching the bottom of the range on the daily chart, more consistent with the SPX at 1100 then at 1070.

This is an indication that investors have started to bet on a bouncing economy or at least on benign inflation data. The stock market should start moving up. From what levels, it is still to be seen. I have rarely seen important bottoms develop during lunch time and that is when the spx started to rally on Friday

Friday, August 20, 2010

Out at 1065

Long Half the Standard Size at 1069.25

Stop at 1065

Update

The market seems to ignore oversold indicators, contrarian indicators and even my expert opinion.

The ES has broken the 1066.5 low in pre-market trading. Unless a miracle rally happens before the US open, I will sit on the sidelines.

Contrarian Signal

Here is the first article on the page of LeMonde.fr (click to enlarge):

The title says: "Markets depressed despite rising profits".

I read this French online news site everyday. It rarely features the stock market on its home page. When the bearish sentiment is so strong that it reaches the home page of a French non-economic news site, it is time to go long.

Analogies

The chart below (SPY) is a snapshot of the July- August 2008 bear market rally:

The similarities to today's market action are quite stunning:
Like now, back then we were in the middle of August, in a bear market rally and on the 25th (highlighted by the blue line in the first chart) the market looked decisively headed for lower lows.

This would suggest that a move up from here is possible. The technical picture hasn't changed. This kind of plunges happen at bottoms quite often. Here is a recent example, July the 27th:
Before acting on a trade idea I decide what conditions would invalidate it. This time it is quite easy: the recent lows (1066.5 on ES) should not be breached.

Given the above and since the oversold condition is still valid, I will buy on weakness today but I will only use half of my standard size. I will add the rest on further confirmation.

Thursday, August 19, 2010

Sold the Other Half at 1076

My position was initiated here and here.

Out of 50% of the Longs at 1078.25

Playing defense. I still think the market can rally today but if it does it will probably happen after the lunch.

Market Outlook: Rally Time!

It seems that as the market moved higher, approaching 1100, the bears were confident enough to add to shorts. It does not get any better than this for the bulls. It is time to add to longs.

Wednesday, August 18, 2010

Market Outlook

The put/call ratio has been rising yesterday (dropping on my inverted chart) despite the big move up:
In my experience this kind of behaviour portends the continuation of the up move.

However, on Wednesday, I would not be surprised by a violent retest of the 1080 level on cash spx. The market should resume its upward move afterwards.

On other matters, here is a chart of the 3 month average of the monthly percent change in CPI:
Note that the series has recently turned from a some kind of support level. If the past is any guide we should be seeing some benign inflation data in the near future. This would be consistent with positive surprises in other economic data like Retail Sales and would support a market rally from here to 1150. The Retail Sales Conundrum is solved!

Tuesday, August 17, 2010

Lines in the Sand

Here is a 30 minute chart of the SPX (click to enlarge):

The brown trendline delimits the recent bottoming activity. As soon as the market passes on the other side it shouldn't go back below it. In that case a retest of this line is a buy for the more conservative bulls that didn't buy yesterday's drop.

The green horizontal line represents the bottom of a range in which the market traded the most during the last 3 days. I have noticed that each time the market went below this level (1080) it quickly reversed above it. This makes it an important level to watch for Tuesday.

In case the market gaps up, the top of the range (about 1085) is also a line in the sand above which the shorts will start to cover.

Monday, August 16, 2010

Added to Longs at 1068 ES

Long full position now with average 1072 ES

Trade Update

I will continue with my plan to add to my longs today (if the market drops to at least 1068 ES). I will place a stop below 1060 ES.

The put/call ratio has not made a big "bearish spike" yet, despite the big move down in the stock market. This is the only caveat for the rally scenario but the ratio can drop today and, also, it is at levels associated with oversold conditions in the past

Saturday, August 14, 2010

The Retail Sales Conundrum

Here is a chart of the 3 month average of the monthly percent change in Real Retail Sales (click to enlarge):
source of data: FRB St. Louis

I use this chart to get a more detailed insight on the path of the economy. Since it is very accurate and quite correlated with the stock market I will be updating it frequently.

Notice how the series drops even during economic expansion periods and then usually bounces off the red horizontal line. We are in the middle of the same process now. The series started dropping, signaling some economic slowdown. The media has done more that its usual job to highlight this slowdown.

The question is whether the bounce that will follow the current slowdown will be as big as it should be in an economic expansion or it will be soft as the ones before the recent recession (circled in green). I am choosing the latter. I have drawn in purple a projected future path.

Also of note is that the circled bounces (late 07 and early 08) were accompanied by market rallies. Probably because during those bounces in retail sales the economic data came in better than expected. This would suggest that the market might rally in the coming months, a scenario that pleases the contrarian in me as the media pessimism on the economy is extremely high.

When exactly is this rally going to start? From what levels? Until I get those answers, I will call this the retails sales conundrum.

Friday, August 13, 2010

Trade Plan

I will add the rest of my position today at 1068 ES. I will exit all longs if we trade decisively below this level. Note that in both of my chosen analogies described in the earlier post the low of the day circled in green was broken before the move up started.

Scenarios

As I stated previously, I think we have seen the start of a bear market. Therefore, the rise from the beginning of July is a bear market rally. One thing I like to do is look at what the market did in some similar contexts in the past. I do not expect the market to act exactly the same now but it gives me an unbiased view of what can happen. In this post I will look at two rallies from the previous bear market.

I am using SPY charts because the intraday behavior is more evident.

Here is nowadays:


March-May 08:


The red box highlights the period most similar to what the market has been doing from the beginning of August 2010. There is an initial rally on the 1st of April, a period of distribution and then a correction with a big gap down and continuation on April the 11th (August the 11th nowadays). I circled in green the day where we are now. This analogy portends a rally to higher highs from these levels.

July-September 08:


Again there is an initial rally, a consolidation, a correction and a day after the big move down that would be yesterday’s correspondent (circled in green). A move up follows but no higher highs.

So, which one will it be this time? Is the market going to make higher highs?

Here’s an update on one of the indicators I introduced before. Note that it has reached the overbought level for bear markets (green circle) and it has fallen sharply. In the previous bear market after this kind of a fall the rally never made it to higher highs.

On the either hand the bearish sentiment in the media is extremely high. Also, the 5 day EMA of the put/call ratio (chart below) hasn’t reached overbought levels (green line). This suggests to me that a bigger rally is in the cards that would probably take us to higher highs.

Since I tend to trust sentiment indicators the most, I will go with the scenario of a move to 1150 for now but I will keep my eyes open for any additional evidence that would negate it.

Thursday, August 12, 2010

Update

I only managed to enter half of my desired size at 1076 ES. The market has not offered any retracement.

Getting Ready to Go Long

I will try to take advantage of the gap down to go long. I especially like the 1067.75 ES level but I am not sure the market will be so generous with me. If the market is ready to go higher this is a good price. I will try to adapt if we don't touch that level.

I do not expect a long rally right away. If we do move higher shortly after the open, I think sellers will come in at about yesterday's close.

US Consumers Still Depressed

The chart below (click to enlarge) presents the weekly aggregate of daily consumer spending data gathered by Gallup. It excludes spending on cars, homes or normal household bills:
Note that during 2008 most values were registered in the 85-115 range (red lines). From the beginning of 2009 this range has shifted down to 55-75 (green lines). This is straightforward evidence of the depressed state the consumers remain in. They were spending almost double in 2008 even if in 2008 the economy entered a recession!

I have also noticed that from February 2010 there were no values registered below 60. Indeed this was a period of some economic strength. That is why I think that new readings below this level will confirm the scenario of economic weakness ahead.

Wednesday, August 11, 2010

Wild Market

As I am writing this, the futures are down about 10 points from Tuesday's close. The market has been gaping down and rallying in a seemingly random manner. It reminds me of the April-May 2008 period, a few weeks before an important top.

The put/call ratio (chart above, click to enlarge) has made a big "bearish spike". I think that in the next days, as the market falls to about 1100, it will indicate an oversold condition (it mostly already does). This will be a buying opportunity for a move to about 1150 cash s&p that will probably be the last one of this intermediate-term move up. The bearishness towards the economy has been reinforced by the Fed statement and is supporting the scenario of a rally.

I also think that this move higher will be accompanied by falling treasuries prices.

Tuesday, August 10, 2010

Quick Update

It seems we won't get a meaningful rally to sell into. I was hoping to short a break of 1132 cash s&p after the 2:15 announcement. Since I am not willing to pay up, I will most probably sit on the sidelines.

Expectations on Fed Behaviour: QE 2.0


Here is a collection of article headlines I put together while browsing the online financial media:

forbes:


wsj:
smartmoney:

barrons:
reuters:
nytimes:
bloomberg:

The main idea is clear: the Fed should do more quantitative easing as deflation is looming and the economy has gotten weaker. This suggests that expectations are oriented towards higher bond prices and a lower US Dollar.

Given the prevalence of this view at the moment and taking a contrarian approach, I would bet on falling t-notes prices and a rising dollar for a while. I would also not expect the Fed to talk down the economy as the latest economic reports (especially the GDP report) were not bad in the current context and, in fact, had some bright spots.

Monday, August 9, 2010

Quick Market Update

I think the strength is going to continue tomorrow heading into the Fed meeting. However, as it looks at this moment, a shorting opportunity emerges. An idea is to sell the spx after the Fed announcement, on a rally. I will refine this idea as we approach 2:15 tomorrow.

Sunday, August 8, 2010

Trade Idea: Short US T-Notes

I have noticed lately the increasing tendency of the media to acknowledge the risk of deflation. Compared to a few months ago when the tilt was clearly towards inflationism, this is a major change. While I think the deflation camp has a solid case, this new obsession offers a trading edge for the contrarian trader, even if only for a shorter period.

The deflation scenario is supported by falling interest rates and a slowdown in the economy. The media has been prompt in highlighting both. They also stress the need for more quantitative easing and the latest job report headline number gives them an excuse to march on this theme more confidently.

All this is reasonable thinking, but when it comes to markets what is reasonable does not necessarily make you money.. The bond prices have started rising when the inflation hysteria was flourishing. Now, as the majority became more aware of it, the deflation risk scenario may be already priced in. Surely, if the deflation scenario materializes the bond prices may go further up but at this moment a good shorting opportunity emerges.

The chart below presents the continuous contract for the 10-year US treasury note (chart courtesy of SaxoBank):


I have delimited by the blue horizontal lines the range in which the market traded at the beginning of 2009. Note that currently bond prices have almost reached the top of this range. I think this area is a good entry point for a short, probably on a rally after the Fed announcement on Tuesday. The red segment highlights a possible move to the bottom of the range.

Friday, August 6, 2010

Pledge to the Stock Market

Listen especially at 1:58:


Out at 1109

Long at 1117 ES

Small size

Quick Update

At first glance the NFP report is not bad but not very good either compared to previous ones. The headline number of -131k is misleading as it includes the post-census job shedding.

Still, the futures are selling off hard. I think 1116.5 is an important level on the ES. If the market does not trade above it shortly after the open there is a big chance that weakness will continue.

Looking for Strength into the FOMC Meeting

I first envisioned a correction leading to the employment report and the Fed meeting. Instead, the market spent the last days in a 10 point range.

The behaviour of the put/call ratio (chart below) makes me think that the break-out will be to the upside. Also contributing to this view is the generally bullish bias leading to the FOMC meetings. The up move will probably culminate in a climax that can be sold for a correction after the Fed announcement.

For a target, I am looking at the 1155 level on the cash index, as projected previously.

The employment report has a big influence on the short term direction of the market. There is a big probability that it will continue the positive tone on the economy set by the reports in the last two weeks. If this happens the market will probably gap up. This will be a difficult situation because a lot of courage is required to buy a gapping up market for the prospect of immediate continuation. I will try to do my best.

However, I will be picky with this trade. For example, a not so good employment report or no opportunity to buy on some weakness will make me sit on the sidelines.

Looking at the recent range in the S&P index I think the 1125 level is important to watch (green line below, click to enlarge). It separates the bulk of the range from some break-out attempts. For the bullish case to hold I would not like to see the market trade decisively below this level.

chart source: SaxoBank

Thursday, August 5, 2010

Market Outlook

The market looks poised to trade higher. The ratio supports this view:


Note that with all the upside in the s&p recently, the ratio did not make a significant "bullish spike".

Nevertheless, I expect a choppy up move and a correction in the coming days. I think another rally will start after this correction but this will probably be the last rally of this intermediate-term leg up. I will update on this view as the picture becomes clearer.

Wednesday, August 4, 2010

Out at 1119 ES

I don't like the way the market reversed the initial strength.

My position was initiated here.

The Limping Foot: Services


The series in the chart above is the 3 month moving average of the monthly percent change in Real Personal Expenditures on Services (click to enlarge).

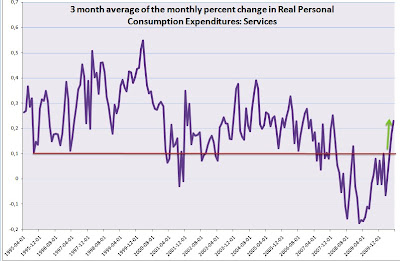
Note that during the recent downturn and the following recovery it has stayed below the prior range from 1995 to 2007 (delimited by the horizontal red line). The weakness of this big part of the US economy is not a secret to anyone.

Can the series speed up? I do not think so. The range during previous recoveries and expansions was roughly 0.3 percentage points. If this time is no different we are close to the top of the range. I have also drawn a trendline on the chart (blue arrow) for the technical analysis fanatics. It will be reached in the coming months, supporting the scenario that there is not much upside left.

Looking at the ISM Non Manufacturing Business Activity Index we can also see that this is about as good as it gets:


On the bright side, recently the series broke above the 0.1 level that had been containing it (green circle). This reflects some strength that was also apparent from the GDP report, suggesting we could see a positive surprise in the ISM Non Manufacturing number today that could move the market higher.


Tuesday, August 3, 2010

More Strength to Follow

Monday was up big but the put/call ratio signals rising bearishness.

click to enlarge

I think this is because the early GDP shorts did not have time to cover yet and the late bulls did not get the chance to enter the market. The rally was too fast. Thus, the divergence shown by the arrows above. This portends more upside for the spx. Here is a projection using the Fibonacci retracements. The next target is 1155.

However if the 1150 level is not reached by Wedenesday or Thursday's open at the latest I will take profits on my position since I expect the market to correct into the NFP report on Friday and the FOMC meeting next Tuesday.

I think on Tuesday oscillation will be the main theme of the market. Early weakness should be bought, but I think the short side can be played too, intraday.